Free Daily Headlines :

  • COVID-19
  • Vaccine Info
  • Money
  • Politics
  • Education
  • Health
  • Justice
  • More
    • Environment
    • Economic Development
    • Gaming
    • Investigations
    • Social Services
    • TRANSPORTATION
  • Opinion
    • CT Viewpoints
    • CT Artpoints
DONATE
Reflecting Connecticut’s Reality.
    COVID-19
    Vaccine Info
    Money
    Politics
    Education
    Health
    Justice
    More
    Environment
    Economic Development
    Gaming
    Investigations
    Social Services
    TRANSPORTATION
    Opinion
    CT Viewpoints
    CT Artpoints

LET�S GET SOCIAL

Show your love for great stories and out standing journalism

COVID in CT: The data that tell the story

  • COVID-19
  • by Kasturi Pananjady
  • January 1, 2021
  • View as "Clean Read" "Exit Clean Read"

The Connecticut Mirror is tracking the latest coronavirus data in Connecticut. These graphics are updated with the latest data as soon as the state publishes them.

Statewide case, death, hospitalization and positivity rate data are updated each weekday around 4 p.m. Some graphics are updated on different schedules, as noted. Unless otherwise specified, the data are sourced from Connecticut’s Open Data portal.

Follow CT Mirror’s COVID-19 coverage here. Questions or ideas about these data? Send us a note at data@ctmirror.org.
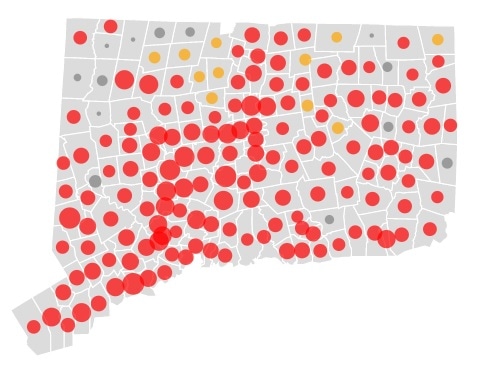
Hover on a county to see the number of people currently hospitalized. Data updated daily.

The state does not report data on weekends. The line shows the 7-day rolling average, which takes into account the lack of data on weekends. Toggle between the grey buttons to filter by date; note that positivity rates in March and April were impacted by the relative scarcity of testing. Data updated daily.

The state does not report data on weekends. The line shows the 7-day rolling average, which takes into account the lack of data on weekends. Toggle between the grey buttons to filter by date. Data updated daily.

The state does not report data on weekends. The line shows the 7-day rolling average, which takes into account the lack of data on weekends. Toggle between the grey buttons to filter by date. Data updated daily.

The state does not report data on weekends. The line shows the 7-day rolling average, which takes into account the lack of data on weekends. Toggle between the grey buttons to filter by date. Data updated daily.

Click on a circle to see the town’s trend line since the state began reporting 14-day case rate data on 10-22. Case rates are calculated in the two weeks prior to the date the data were reported; towns with fewer than five cases are in the grey zone. Nursing home residents and incarcerated people with COVID-19 are not included in the data. Figures updated weekly.

The state does not report data on weekends; county hospitalization data is the most granular reported by the state. Mouseover for raw number of hospitalizations and comparisons to the county’s peak. Data updated daily.

Source: Centers for Medicare and Medicaid Services. The rates reflect the percent positivity in the preceding 14 days. Mouseover a bar to see date and rate values. Data updated weekly. Credit: Kasturi Pananjady

Toggle between the grey buttons to compare estimated first doses with those allocated to Connecticut. Hover for precise values. Data updated weekly. Source: Health and Human Services

What test positivity tells you — and what it doesn’t

The positivity rate is a “fairly crude way to see if we’re doing enough testing,” according to Yale Professor of Epidemiology Ted Cohen. In Connecticut, the positivity rate is defined as the number of cases divided by the number of tests reported each day. It’s often talked about in the context of assessing COVID-19 spread, but it is highly influenced by fluctuations in testing patterns.

For instance, high positivity rates in March and April reflect the relative scarcity of testing over that period, and any comparison to present-day rates must keep that in mind, he said.

“The pool of people we were testing in the spring is totally different from who is being tested now. The tests were more restricted to people who were severely ill, and there were shortages of tests. Therefore, you can’t directly compare the numbers of positive tests between the spring and now,” said Yale Associate Professor of Epidemiology Dan Weinberger.

The World Health Organization’s 5% positivity threshold for reopening is somewhat arbitrary, Cohen said, but in general, a high positivity rate indicates that testing data isn’t capturing the full case count.

Daily case data is a snapshot of the past — not a reflection of the present

The governor’s briefings and the CT Mirror’s case-count charts report test data based on the day that the result comes back from a lab. As there is a variable time delay between getting tested and getting a result back, these data will be showing the past, not the present.

The case rate data by town, on the other hand, releases data by the date that a person was tested. Therefore, the case numbers in the town-by-town bubble chart reflect active COVID-cases over the previous two weeks. The data are updated weekly.

Deaths trail behind cases

While the case data on a given day is a snapshot of the past, it is also a clue to what people might eventually see in the death data.

In general, deaths trail behind cases by about two to three weeks, Cohen said. The delay is because of the nature of the disease and the time it takes to prove fatal; it is also influenced by the process of recording deaths. “This lag has been abused by many people” to question the severity of the disease, Cohen said, but only time can reveal the full impact of the pandemic.

That said, the extent of the spike in deaths following a spike in cases may not be the same as it was in March, Cohen said. In part, this is because doctors and nurses are better equipped to handle the virus now than they were then. Those infected today might also be less vulnerable, particularly if they are younger.

Case rates by town do not include nursing homes and correctional facilities

While this means that the town map does not provide a comprehensive picture of the virus in an area, separating out nursing home and prison data can provide most town residents with a more accurate understanding of their risk of exposure “if these are truly isolated populations within these community where there’s little to no interaction,” Cohen said.

Case rates by town don’t normalize for testing variation

The sheer number of tests might differ by town, and “that is a potential source of bias,” Cohen said. College towns, for instance, may see higher testing numbers because universities are testing communities on a regular basis. The town-by-town case rate data includes cases from schools and universities, confirmed Pauline Zaldonis, the dataset’s manager.

That means that some towns may be doing a better job of identifying cases than others, resulting in higher case rates.

The state of Connecticut’s COVID-19 website also features a forum where Connecticut residents can request COVID-19 datasets that are not already available, said Scott Gaul, the state’s chief data officer. “It’s been unexpected how much people have used it,” he said. “We’ve had more comments come in the last six months than in the first six years that the [Open Data] portal was online.”

Sign up for CT Mirror's free daily news summary.

Free to Read. Not Free to Produce.

The Connecticut Mirror is a nonprofit newsroom. 90% of our revenue comes from people like you. If you value our reporting please consider making a donation. You'll enjoy reading CT Mirror even more knowing you helped make it happen.

YES, I'LL DONATE TODAY

ABOUT THE AUTHOR

Kasturi Pananjady Kasturi Pananjady is CT Mirror’s data reporter. She is a May 2020 graduate of the Columbia Journalism School’s master’s program in data journalism and holds a degree in comparative literature from Brown University, where she was editor-in-chief of the student newspaper. Prior to joining CT Mirror, Kasturi interned for publications in India.

SEE WHAT READERS SAID

RELATED STORIES
‘It’s a nightmare:’ A growing number of seniors are unable to book vaccine appointments as problems mount
by Dave Altimari and Jenna Carlesso

The state acknowledged Friday in an email to local health workers that some residents are waiting days for a callback.

Vaccinations in nursing homes top 64,000; COVID cases are dropping rapidly among residents
by Dave Altimari

There were 238 COVID infections reported in nursing homes last week, down from 483 a few weeks ago.

Advocates call on state to improve response to vulnerable students
by Adria Watson

State child advocate Sarah Eagan and attorney Martha Stone want the state to do more for these students during COVID.

More than 300 teachers vaccinated at Southbury clinic; State says older residents should come first
by Dave Altimari

Some teachers are getting vaccinated while the state is trying to get the COVID-19 vaccine out to older residents first.

Lamont to lead NGA task force on pandemic response
by Mark Pazniokas

Gov. Ned Lamont will co-chair a National Governors Association task force on pandemic and disaster response.

Support Our Work

Show your love for great stories and outstanding journalism.

$
Select One
  • Monthly
  • Yearly
  • Once
Artpoint painter
CT ViewpointsCT Artpoints
Opinion Miguel Cardona, who are you?
by Ann Policelli Cronin

When I ask Connecticut teachers about Miguel Cardona, those who know him or have worked with him say that he is really nice guy who knows what the challenges in our classrooms are, knows how to help teachers to improve their teaching, and respects public schools. All good. But what is his vision for teaching and learning that he will bring to the U.S. Department of Education?

Opinion Connecticut needs a strong two-party system, this Democrat says
by Edward Marcus

J.R. Romano’s recent resignation as the state’s Republican Party chair has brought into focus the need for a viable opposition party in Connecticut. It is not healthy politics when everything is totally controlled by one party:  the legislature, the governorship, and most of the major municipalities in our state.

Opinion Connecticut’s $100 million college shell game
by Stephen Adair

The plan to consolidate the 12 community colleges in Connecticut into one college with 12 campuses is called “Students First,” which is ironic because it does not fund students first.  It funds a new administration in a new, statewide bureaucracy. The Board of Regents (BOR) and the Connecticut State Colleges and Universities (CSCU) system office […]

Opinion Inconsistent television captioning is a barrier to equal access
by Jeffrey Bravin and Barbara Cassin

Our world long ago entered the age of the 24-hour news cycle, and a full understanding of the “who, what, when, where and why” of the news is critical for deaf, deafblind and hard of hearing citizens. Yet, Connecticut’s inconsistent quality of television captioning locks our community out of the complete sense of what is happening.

Artwork Grand guidance
by Anne:Gogh

In a world of systemic oppression aimed towards those of darker skintones – representation matters. We are more than our equity elusive environments, more than numbers in a prison and much more than victims of societal dispositions. This piece depicts a melanated young man draped in a cape ascending high above multiple forms of oppression. […]

Artwork Shea
by Anthony Valentine

Shea is a story about race and social inequalities that plague America. It is a narrative that prompts the question, “Do you know what it’s like to wake up in new skin?”

Artwork The Declaration of Human Rights
by Andres Chaparro

Through my artwork I strive to create an example of ideas that reflect my desire to raise social consciousness, and cultural awareness. Jazz music is the catalyst to all my work, and plays a major influence in each piece of work.”

Artwork ‘A thing of beauty. Destroy it forever’
by Richard DiCarlo | Derby

During times like these it’s often fun to revisit something familiar and approach things with a different slant. I have been taking some Pop culture and Art masterpieces and applying the vintage 1960’s and 70’s classic figures (Fisher Price, little people) to the make an amusing pieces. Here is my homage to Fisher -Price, Yellow […]

Twitter Feed
A Twitter List by CTMirror

Engage

  • Reflections Tickets & Sponsorships
  • Events
  • Donate
  • Newsletter Sign-Up
  • Submit to Viewpoints
  • Submit to ArtPoints
  • Economic Indicator Dashboard
  • Speaking Engagements
  • Commenting Guidelines
  • Legal Notices
  • Contact Us

About

  • About CT Mirror
  • Announcements
  • Board
  • Staff
  • Sponsors and Funders
  • Donors
  • Friends of CT Mirror
  • History
  • Financial
  • Policies
  • Strategic Plan

Opportunity

  • Advertising and Sponsorship
  • Speaking Engagements
  • Use of Photography
  • Work for Us

Go Deeper

  • Steady Habits Podcast
  • Economic Indicator Dashboard
  • Five Things

The Connecticut News Project, Inc. 1049 Asylum Avenue, Hartford, CT 06105. Phone: 860-218-6380

© Copyright 2021, The Connecticut News Project. All Rights Reserved. Website by Web Publisher PRO