


This story is part of CT Mirror Explains, an ongoing effort to distill our wide-ranging reporting into a "what you need to know" format and provide practical information to our readers.
This article is part of CT Mirror’s Spanish-language news coverage developed in partnership with Identidad Latina Multimedia.
The U.S. is watching a rare redistricting arms race instigated at mid-decade by a president anxious to preserve his party’s fragile majority in the U.S. House of Representatives in next year’s midterm elections.
Texas redrew its congressional map with the stated goal of electing five more Republicans to Congress next year. California is responding with an effort to do the same in favor of Democrats. Now, Missouri is getting in the act for the GOP.
Where will it end?
Well, not in Connecticut.
Democrats control two-thirds of the seats in the General Assembly and the office of the governor, but they cannot unilaterally draw more favorable maps in either congressional or state legislative districts. And even if they could, Democrats already hold all five congressional seats.
One side effect of Texas delivering President Donald J. Trump a made-to-order congressional map is the buzz — OK, more like misinformation — on social media about whether Connecticut’s solid-blue map is the product of the same hardball politics we’re seeing in Texas, California and Missouri.
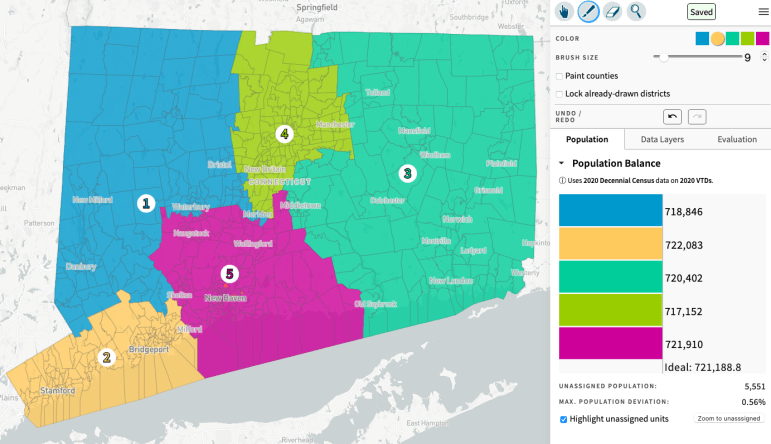
Here’s how redistricting really works in Connecticut, how the congressional delegation went from 60% red to 80% blue in the midterm election of 2006, and why some people think they see a lobster claw in the congressional map.
Is the absence of CT Republicans in Congress evidence of gerrymandering?
No, though the current congressional map is flawed, as judged against redistricting principles, such as making a district as compact as possible. And it makes little sense today, unless you understand its origins and how it was produced.
But it wasn’t a Democratic gerrymander. In fact, it initially favored Republicans.
The foundation of the current map are the radical changes forced by the 2000 Census, when Connecticut lost one of its six U.S. House seats. It has since been only lightly tweaked after the census results of 2010 and 2020.
Democrat James Maloney of Danbury, who represented the 5th District, and Republican Nancy Johnson of New Britain, who represented the soon-to-be-extinct 6th District, ended up in the same district in 2002.
The newly drawn 5th was drawn less to serve the interest of voters than those of Maloney and Johnson. The goal was to set up a fair fight, which required hollowing out the once-compact 1st District of Greater Hartford.
Johnson won in 2002. In fact, Republicans won three of the five seats in 2002 and 2004. Democrats flipped the 5th and 2nd in 2006, capitalizing on the unpopularity of George W. Bush and the war in Iraq.
They completed the sweep in 2008, capturing the 4th in Fairfield County, helped by the coattails of Barack Obama.
Johnson and Maloney are long gone from active politics. The ugly border between the 1st and 5th — the lobster claw —remains.
Why are congressional maps rarely drawn at mid-decade?
The impetus usually is equalizing the population of congressional districts after the completion of a decennial census, not reacting to the prospect of one party losing the House in a coming election.
Allocating congressional seats by population is a zero-sum game. The number of House seats remains constant at 435, and the courts have ruled each district should have roughly the same population to the extent that is practical.
So that means the greater population growth in southern and western states shifted political power. The 2000 Census resulted in Arizona, Florida, Georgia, and Texas gaining two House seats, and California, Colorado, Nevada, and North Carolina gaining one.
New York and Pennsylvania lost two. Connecticut, Illinois, Indiana, Michigan, Mississippi, Ohio, Oklahoma, and Wisconsin lost one.
Who draws the maps in Connecticut?
In some states, winning control of the legislature means one party is in charge of drawing the map. Not so in Connecticut. The state constitution gives the task to an eight-person legislative committee with an equal number of House and Senate Republicans and Democrats.
If they cannot agree on a map, then the legislators must choose eight members for a new reapportionment commission. Those eight members then must agree on a ninth member. If that fails to produce a consensus, the task of drawing new districts falls to the state Supreme Court.
Every 10 years, the legislators have little trouble negotiating new state legislative districts. But they have deadlocked on making changes to the congressional map.
The result is that revising the congressional map after the 2010 and 2020 census was punted to the Supreme Court and a court-appointed special master, who have made only the minimal changes necessary to equalize the populations of the five districts.
The court’s rationale: The map produced after the 2000 Census was fairly done, and it is up to the General Assembly to make more significant changes.
By the way, mapping software has made it relatively easy to draw new districts.
If not the maps, how do you explain the lopsided results favoring Democrats?
The answer is numbers and trends.
First, the numbers. Only 21% of registered voters are Republicans, compared to 36% Democrats and 42% unaffiliated. Upscale suburbs that once were the GOP’s foundation, especially in Fairfield County, have been trending blue, just as some blue-collar suburbs have been going red.
The trend accelerated since the election of Trump.
Republicans fell to their modern low in 2008, when Obama’s popularity helped Democrats win majorities of 114-37 in the state House and 24-12 in the state Senate. The GOP steadily made gains, falling just short of majority in the House and winning an 18-18 tie in the Senate.
The GOP actually did fine with Trump topping the ballot in 2016, even though he badly lost the state: Republicans won an 18-18 tie in the state Senate and came within four seats of a House majority.
But every election since Trump’s victory has been a problem for Republicans. The same legislative map that nearly produced parity in 2016 gave Democrats huge majorities in 2018 and 2020.
The trend continued with the version produced after the 2020 Census.