


Connecticut’s awkward congressional map, a legacy of losing one of its six seats 20 years ago, is unlikely to get a major overhaul by the state legislature’s bipartisan Reapportionment Commission.
The rules of reapportionment are heavily stacked in favor of the status quo unless Democrats and Republicans agree on radical change to a map that initially favored the GOP but has produced only Democratic victories since 2008.
“Generally speaking, less change is better for the Democrats. They’ve held the seats for a decade and would like to continue to,” said House Minority Leader Vincent J. Candelora, R-North Branford.
House Speaker Matt Ritter, D-Hartford, and Senate Majority Leader Bob Duff, D-Norwalk, said they see no reason for anything but the tweaks necessary to equalize the population of the five districts based on the 2020 Census.
“That’s all we need, a little nip and tuck,” Duff said.
If so, the 5th District will continue to claw into the 1st District, a bipartisan gerrymander devised in 2001 to serve the interests of two incumbents placed in the same district, a Democrat from Danbury and a Republican from New Britain.
When the 2000 Census resulted in Connecticut going from six to five districts, U.S. Reps. James Maloney, D-5th, and Nancy Johnson, R-6th, were pitted against each other in a 5th District redrawn to make for a fair fight.
Maloney and Johnson soon would be gone from elective politics.
Johnson beat Maloney in 2002, and Democrat Chris Murphy unseated Johnson in 2006. But the map contorted to serve them survives, nearly impossible to change.
The difficulty lies in politics and process, not math or mapmaking.
With a bipartisan commission, no party can dictate a result. Deadlocks essentially are broken by the Supreme Court, which made only the minimal changes required 10 years ago to equalize the populations of the districts.
“I think the court is not interested in being in the business of redistricting,” said Sen. Paul Formica, R-East Lyme, the Senate GOP deputy leader and a Reapportionment Commission member.
The commission is composed of four Democrats and four Republicans: the Senate president pro tem and the House speaker, who are Democrats, and the House and Senate majority and minority leaders, plus two deputy minority leaders.
The eight appointed a neutral ninth member, ostensibly a tie-breaker. But following precedent, the neutral member, John McKinney, has agreed not to play that role, meaning that no map will be adopted without either a bipartisan deal or court intervention.
The commission unanimous agreed on new boundaries for 151 House and 36 Senate districts in the General Assembly but failed to settle on a congressional map by the constitutional deadline of Nov. 30.
The missed deadline means the congressional map will be subject to oversight by the Supreme Court, as was the case in 2001 and 2011. The commission is technically on hiatus until the court approves a deadline extension.
Thanks to the availability of web tools preloaded with maps, block-by-block census data and election results, the actual work of mapmaking is not difficult.
At Trinity College, the students in Professor Kyle Evans’ “Mathematics and Redistricting” class used one of the web sites, DavesRedistricting.org, to quickly produce maps that are geographically compact and respect the districts’ current regional bases.
“We did this in the class period, more or less an hour,” Evans said.
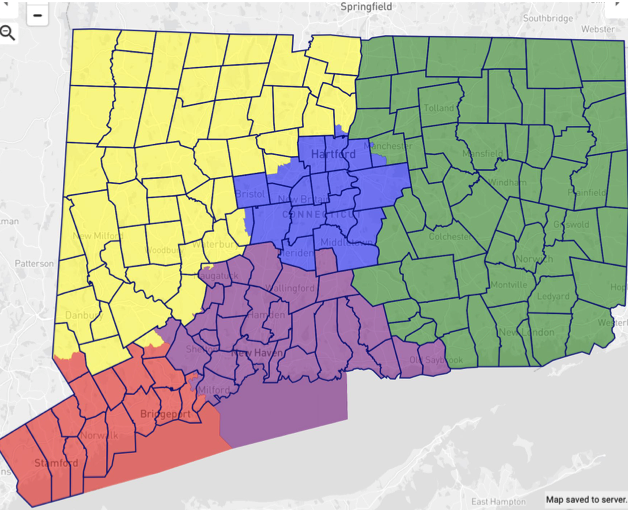
Evans’ class followed basic guidelines: Each district must have 721,189 people, one-fifth of the state’s population of 3.6 million; and municipal borders should be respected to the greatest extent possible.
Connecticut grew by not quite 32,000 people in the past decade, mostly in Fairfield County. Hartford, as well as rural communities in eastern Connecticut lost population.
The sprawling 2nd District of eastern Connecticut needs to get bigger and pick up another 21,288 residents, while the compact 4th District of lower Fairfield County needs to get more geographically compact and shed 25,627 people.
The population deviations are smaller in the other districts: the 1st and 3rd are under by 3,535 and 5,829, respectively, while the 5th is over by 5,024. Since the overpopulated 4th and underpopulated 2nd share no border, changes will have to ripple across the map.
Unlike the Reapportionment Commission, Evans’s class ignored the political gains and losses attendant to shifting borders.
Evans did a map in 30 minutes.
“That was with no political consideration, no incumbent consideration whatsoever,” he said.
Republicans won three of the five seats in 2002 and 2004, losing only the 1st and 3rd, the districts centered around Hartford and New Haven. But political trends have not favored the GOP.
Democrats have won every congressional election since 2008, when Democrat Jim Himes unseated Republican Chris Shays in the 4th District, which had been held for 40 years by a succession of GOP moderates: Lowell P. Weicker Jr., Stewart B. McKinney and, finally, Shays.
Based on composite votes cast since 2016 for president, governor, senator and attorney general, the 4th District now rivals the 1st and 3rd as a safe Democratic base. Democrats won 60.4% of those votes in the 1st, 60% in the 4th and 58.7% in the 3rd.
The other two districts only lean Democratic, with the party winning 52.1% of the composite vote in the 2nd and 51.9% in the 5th. As a result, small changes could make them more competitive — if not next year, then when the seats are open.

Ten years ago, the Republicans proposed a map that would have made the 4th and 5th friendlier to GOP candidates. They proposed shifting Democratic Bridgeport from the 4th to the 3rd and Democratic New Britain from the 4th to the 1st.
Democrats argued then that the map produced in 2001 was fair to both parties, and the court basically agreed.
“So that becomes to me the legal starting point,” Ritter said.
The Democrats and Republicans have yet to exchange congressional maps.
“If I saw a map that moves the entire city of New Britain to the 1st or Bridgeport to the 3rd, I’m not voting for that,” Ritter said. “The population trends don’t necessitate being more aggressive.”
Candelora said the commission could adopt a map that doesn’t dramatically shift the balance of power but makes more sense geographically.
If they’d like, Professor Evans of Trinity has some models — and several were submitted to the commission. Common Cause of Connecticut also has a gallery of maps produced by the Trinity students and others.