
Debate rages at the state Capitol and across Connecticut over how much to cut the state’s share of funding for the University of Connecticut. Here, in graphical form, is an overview of where the public university gets and spends its money, who it enrolls, how many it employs, and how it compares to other universities in research and endowment.
Story in Charts

Posted inEducation, Money, Politics
The state of CT’s cities and towns in charts
State aid to municipalities largely has been spared cuts over the last decade – and has even been increased in some years – even though the state has regularly faced budget deficits. Now it’s time for some municipalities to share in the pain, the Malloy administration maintains. As the debate rages, here, in graphical form, are some key indicators of the fiscal condition of the state’s 169 cities and towns and how they are spending their money.
Posted inEducation
The status of UConn research in 18 charts
Here, in graphical form, is a historical overview of research activity at UConn and UConn Health and how it compares to other schools across the country. This is the third in a three-part series.
Posted inHealth
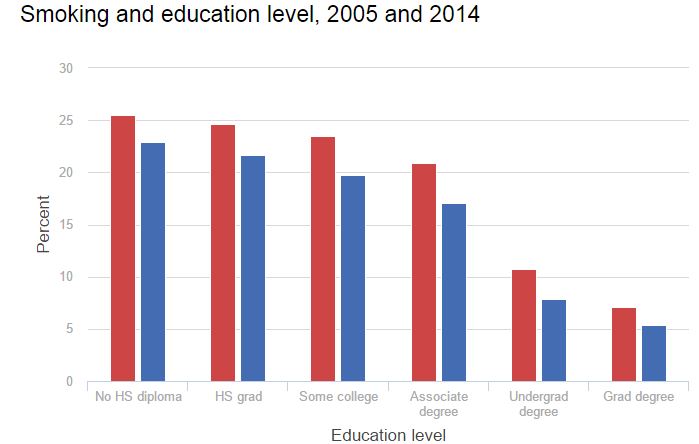
The story in charts: Who still smokes?
Smoking is down significantly across the country, and the rate is even lower in Connecticut. But the overall picture masks significant disparities in who the remaining smokers are.

Posted inEducation, Justice
The state of Connecticut juvenile incarceration in 17 charts
Each year about 3,000 children enter Connecticut’s juvenile justice system after being convicted of breaking the law. Here, in graphical form, is a historical overview of what happens to youth after they are found guilty, including details on the jails where about 200 youths each year are sent to live.
Posted inEducation
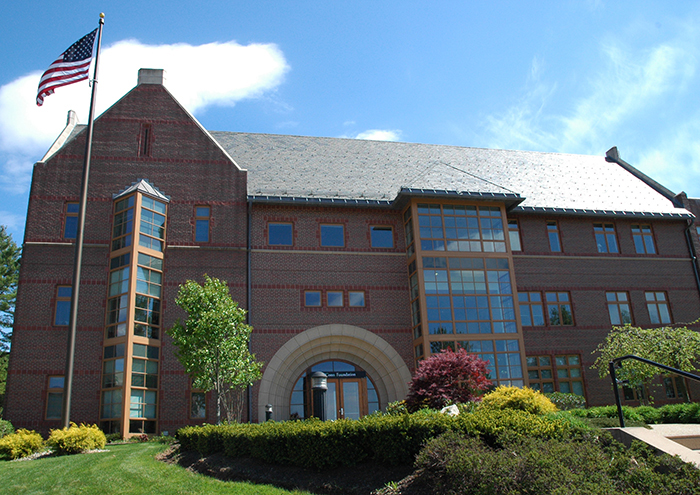
A UConn Foundation profile in six graphs
The University of Connecticut spends $7 million each year supporting its foundation; and in return that fundraising arm doles out about $40 million a year. Here are six charts that profile the UConn foundation’s financial performance.

Posted inEducation, Money
The state of UConn in 15 charts
The University of Connecticut has been undergoing tremendous growth recently — partly evidenced by the $1.3 billion budget officials adopted last week. Here, in graphical form, is a historical overview of where the public university gets and spends its money, who it enrolls, and how many it employs.