


It’s the mantra of coastal geologists, shoreline experts and other seaside observers: Shorelines move.
They move because of nature. They move because man moves them. And they move in complex mixtures of both, punctuated by the simple passage of time.
Connecticut’s Long Island Sound shoreline is no exception, and while we may not know specifically why, we now have a better idea of how, where, how much and how fast the shoreline has moved in the last 130 years.
Using drawings and photos beginning in the 1880s and data from hundreds of sites, three groups of experts have been working together to document and quantify that movement: from Connecticut Sea Grant, a joint program of the National Oceanic and Atmospheric Administration and the University of Connecticut; UConn’s Center for Land Use Education and Research (CLEAR); and the state’s Department of Energy and Environmental Protection (DEEP).
“This tells you where the soft spots are,” said Joel Stocker, an educator and mapping expert with UConn’s Cooperative Extension and CLEAR, who has been crunching data for the better part of a year.
The softest spots, showing the greatest loss of shoreline land, are where the geology is generally weaker – areas the researchers describe as glacial drift and beaches. Loss is most pronounced on barrier beaches, those strips of sand all or partially detached from the mainland. Connecticut’s sandy beaches are found mostly from Norwalk to Milford and a larger swath from Guilford to Old Lyme.
Rockier areas tend to show less change and a slower rate of it since they erode less and move less. But even within those rocky shores are places like Cosey Beach, the barrier beach in East Haven hit hard in storms Irene and Sandy in 2011 and 2012. There’s been a net loss of shoreline there.
The results provide “an important perspective and objectivity instead of relying on what we might remember about a certain area,” said Juliana Barrett of Sea Grant, who coordinated the project.
The long time-frame also shows that while the state may continue to reel from catastrophic damage in recent storms, that’s just a small part of the bigger picture. But a shorter-term set of data, from 1983 to 2006, shows that shoreline loss was more pronounced in those years, and the rate of change was faster.
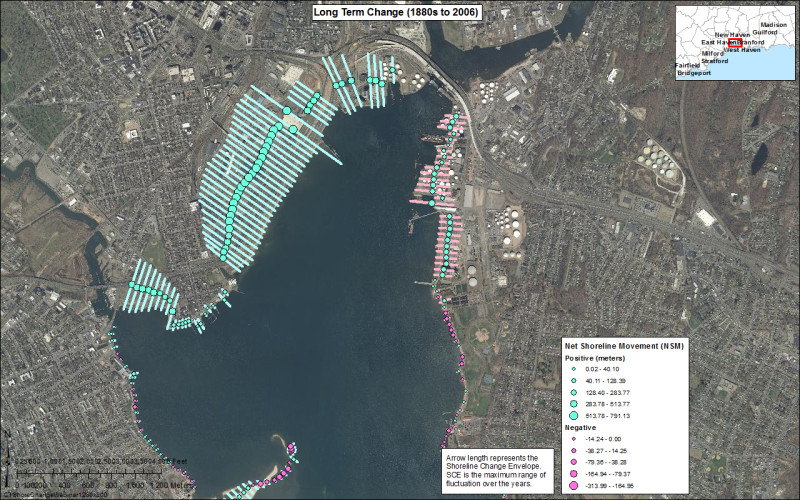
The bigger picture also includes human intervention. New Haven, for instance, has had a huge increase in its shoreline due to the massive filling-in of areas along the western edge of the harbor known as Long Wharf. Before World War II, that area was water.
Bridgeport, New London and Greenwich also have filled-in areas. But Stocker said it’s hard to always know exactly what’s going on at ground level or even below sea level right at the shore. Man-made additions like seawalls and breakwaters may have stopped, slowed or altered natural water, sediment and marsh movement.
“This shows you only what you can see from looking straight down,” said Stocker, of the bird’s eye views in the drawings, even those done before airplanes. “There’s so much going on. People put sand back. People know change is trying to take place, but they’re fighting it.”
“If you stop [change],” he said. “There are consequences.”
The Silver Sands State Park area of Milford is one example. Photos show homes were built all along the beach and on fill in the large salt marsh next to the beach before the Hurricane of 1938, when some were destroyed. Then, when dozens more homes were destroyed in Hurricane Diane in 1955, the state acquired more than 300 parcels. Homes were removed and in developing the park, the state allowed the salt marsh to largely return to nature.
But that’s not the end of the story. Scientists know that sediment in Long Island Sound generally flows from east to west. In Milford, that’s meant a shoreline buildup at its western-most tip along the Housatonic River with sand stripped from further east, like from Silver Sands.
Breakwaters appear in the Silver Sands area between 1965 and 1990, and subsequent photos show uneven sand buildups between those walls. Does one have something to do with the other? Hard to know.
“It’s neat from a land use perspective,” said Emmeline Harrigan, Milford’s assistant city planner and floodplain manager, noting how the marsh changed once it was left alone. “Even the size of the tidal marsh itself – vegetating itself at the rear portion. Whatever transpired – it wasn’t as wet.”
In Guilford, photos show the salt marsh next to Guilford Point at the mouth of the West River being filled and developed with homes over time. John Henningson, who chairs the town’s Hazard Mitigation Commission and is an environmental engineer, said the photos also show a loss of land along the eastern bank of the river.
“These aerials and those that I have, clearly show a loss of several hundred feet,” he explained.
Is the land loss because the filled-in salt marsh couldn’t absorb as much water? Are there seawalls in some places causing erosion elsewhere? Is the land loss because of sea level rise as a result of climate change?
Researchers don’t know here or anywhere along the Connecticut coast exactly what factors are causing the water to encroach into or recede from land areas, except for the well-documented areas that have been filled for development. They are equally adamant that their data can’t be used to predict future change.
Kevin O’Brien of DEEP charted the data for the project. He called the older information, most of which was done for navigational purposes, “spot-on despite all the potential sources of error.” But he said over the century that followed there are gaps in the data, and some data that’s clearly wrong.
“It gives us a cursory level of a sense of magnitude,” he said. “For really the first time in, at the very least 30, 40 years, we now have a set of data there that will at least put a consistent look on what the shoreline has done.”
The area perhaps providing the biggest lesson is Griswold Point, an untouched barrier beach strip in Old Lyme off the eastern mouth of the Connecticut River. Since 1880, photos have shown that strip, called a barrier spit, growing, being breached, and growing again.
“If you go back into the 1800s, I think that thing has built, been cut through, built about four times or five times that we know of,” said Ralph Lewis, who was Connecticut’s state geologist for 30 years and still teaches shoreline geology at area colleges.
Lewis also likes to point to what’s known as The Rock – a boulder on the Griswold Point beach that is clearly visible on land until the early 1930s. It appears in paintings – including William Chadwick’s “Bathers at Griswold Beach,” done around 1915 – with the boulder on land.
But “The Rock” now sits 100 feet offshore.
“Why is simple,” Lewis said. “Beaches move landward in a rising sea.”
For local officials, the shoreline change study offers guidance on what parts of their community to keep an eye on. Barrett said the analysis, coupled with a study on wave dynamics, will offer better information on what parts of the shoreline are suitable for more natural forms of protection, like dunes and grasses in living shorelines to cope with sea level rise and more and bigger storms.
But Stocker worries that because shoreline management decisions are often political, not scientific, the new measurements could have an unintended consequence – they could give ammunition to those who see a vulnerable area and want to put up walls and other hard structures to keep the water out. Steps like this could have consequences elsewhere.
It’s all part of understanding this resource.
“Shorelines are the most active part of the world,” Lewis, the geologist, said. “They move all the time; change is normal for shorelines.”
Interactive graphics were created by data editor Alvin Chang.