


A blue wave swept across Connecticut Tuesday to give Democrats solid majorities in the General Assembly, but the race for governor offered little sign of a political realignment. If anything, the reds got redder and the blues got bluer on the state’s electoral map.
In the race for governor, almost 100 towns voted more strongly in favor of the party they had chosen in 2014. Further evidence of an increasingly polarized state was an increased share of registered voters choosing sides rather than declining to affiliate with a major party.
In 2014, Gov. Dannel P. Malloy beat Republican Tom Foley by 28,019 votes, dominating 47 of the state’s more populous communities.
On Tuesday, Democrat Ned Lamont defeated Republican Bob Stefanowski by 38,672 votes, according to unofficial counts. These numbers could change a bit as they are finalized.
Democrats gained a net of three towns, so there were 119 red towns and 50 blue towns Tuesday — still, not that far off from 2014.
Shades of red and blue
Simply counting a town as red or blue doesn’t tell us how red or how blue that town is.
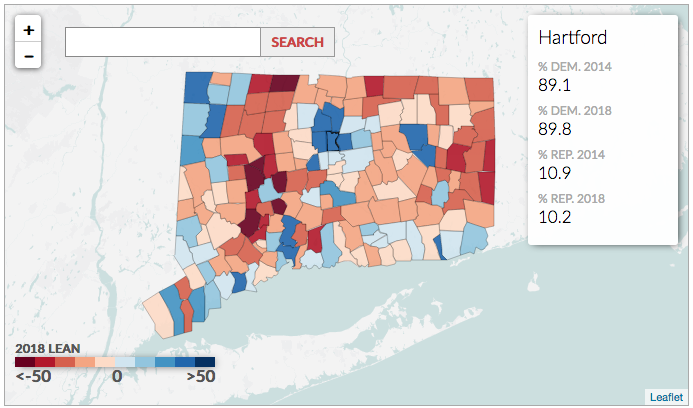
To do this we’ll look at how much it “leans” to one side or the other — the point difference between the percentage of votes the the Democrat received and the percentage of votes the Republican received.
There’s a big difference between the dark and light shades.
For example, Glastonbury was the faintest blue on the map Tuesday. Lamont received 45.58 percent of the votes, compared with 45.49 for Stefanowski. That’s a Democratic lean of 0.09 points. The difference came down to 16 votes separating the winner from the loser in that town.
Hartford was the darkest blue. It had the biggest lean of any city and town in either direction: a 77-point Democratic lean. Again, that’s what we get by subtracting the 10 percent of votes Stefanowski got from the 87 percent Lamont got.
The following map is colored based on a town’s lean toward either party:
Leaning further away from center
OK, so now that we have the “lean” business down, let’s see how towns changed from 2014 to 2018.
There were 99 towns on Tuesday that leaned further in favor of the party that won in 2014: 71 became more red, while 25 became more blue.
Another 53 towns stayed with the same party but moved more toward the center: 41 became less red and 15 became less blue.
The 17 remaining towns crossed over the center line. Seven towns flipped from blue to red, voting for Malloy in 2014 and Stefanowski on Tuesday. Ten flipped the other direction, from red to blue.
This map is just like the one above, but it shows only the towns that flipped from one side to the other.
Taking sides
While red towns are getting redder and blue towns are getting blue, more voters were affiliated with major parties going into Tuesday than any statewide election in Connecticut since 2000.
More than 40 percent of registered voters in Connecticut are unaffiliated or affiliated with a minor party, making that group bigger than either the Democratic or Republican party in Connecticut.
That’s been true since the mid-1990s, but the the unaffiliated dominance has been diminishing. Democrats are inching closer to taking the top spot again, according to more than a half-century of voter registration snapshots the Secretary of the State’s office compiles just prior to November elections.
In 2008, when Barack Obama was running for president the first time, Democrats gained a two-point share of the voter rolls in Connecticut. In the latest report by the Secretary of State, Democrats gained close to another two points, climbing to 38.6 percent of registered voters. Another two points could put them on top.