

Here’s a look at how Gov. Ned Lamont’s proposal to cut CT’s state income taxes would affect single tax filers.
CT Mirror Data
Posted inData
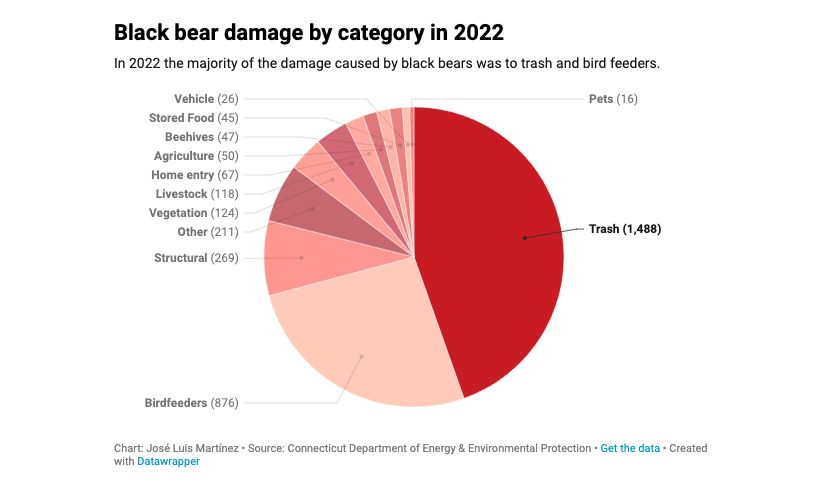
CHART: Black bear damage in CT by category in 2022
Most bear reports in CT are of bears going after trash and bird feeders, data show. In 2022, there were sightings reported in 158 towns.
Posted inData
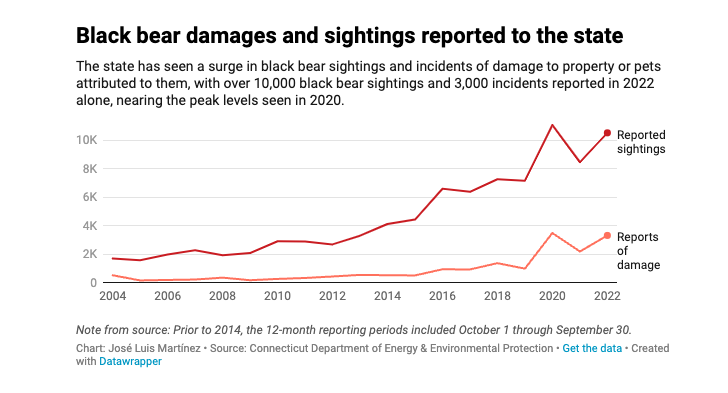
CHART: Black bear damages and sightings reported to the state
The state has seen a surge in black bear sightings and incidents of damage to property or pets attributed to them. Here are the numbers.

Posted inData
CHART: Connecticut’s top six rankable leading causes of death
In CT, the leading rankable causes of death from 2010 through 2020 include heart disease, cancer, COVID-19, accidents and strokes, data shows.

Posted inData
CHART: CT’s greenhouse gas emissions have fallen, but state not on track to meet goal
In the past decade, overall greenhouse gas emissions in CT have dropped, but certain sectors are delaying the state’s goals.
Posted inData
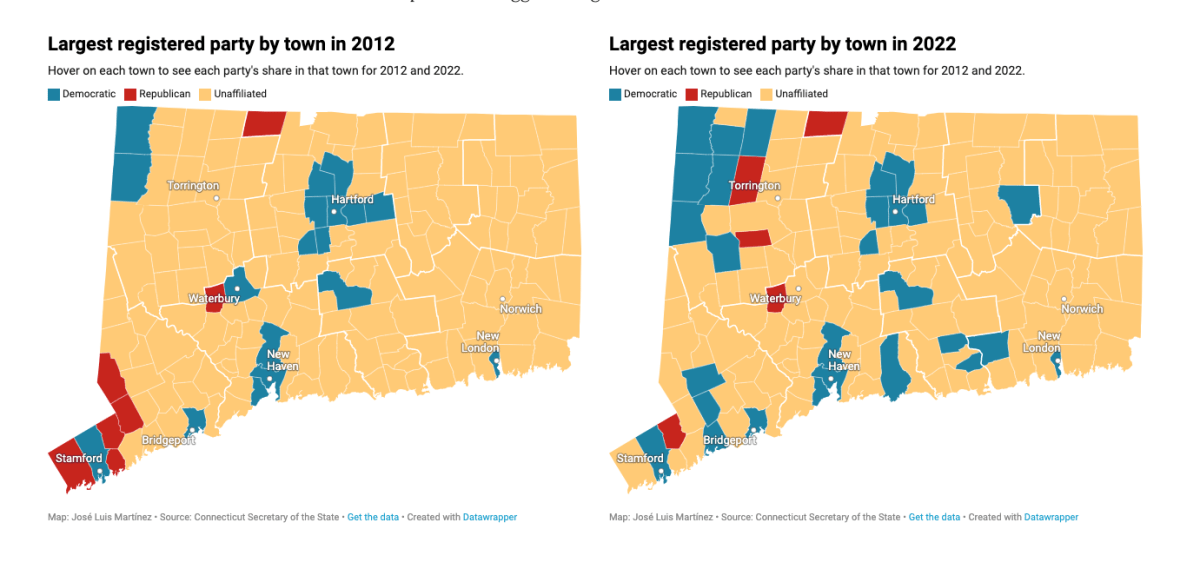
MAPS: How has political affiliation in CT’s towns changed from 2012-2022?
From 2012-2022, Democrats went from being the largest voting group in 18 CT towns to 28. Republicans went from carrying seven towns to five.
Posted inData
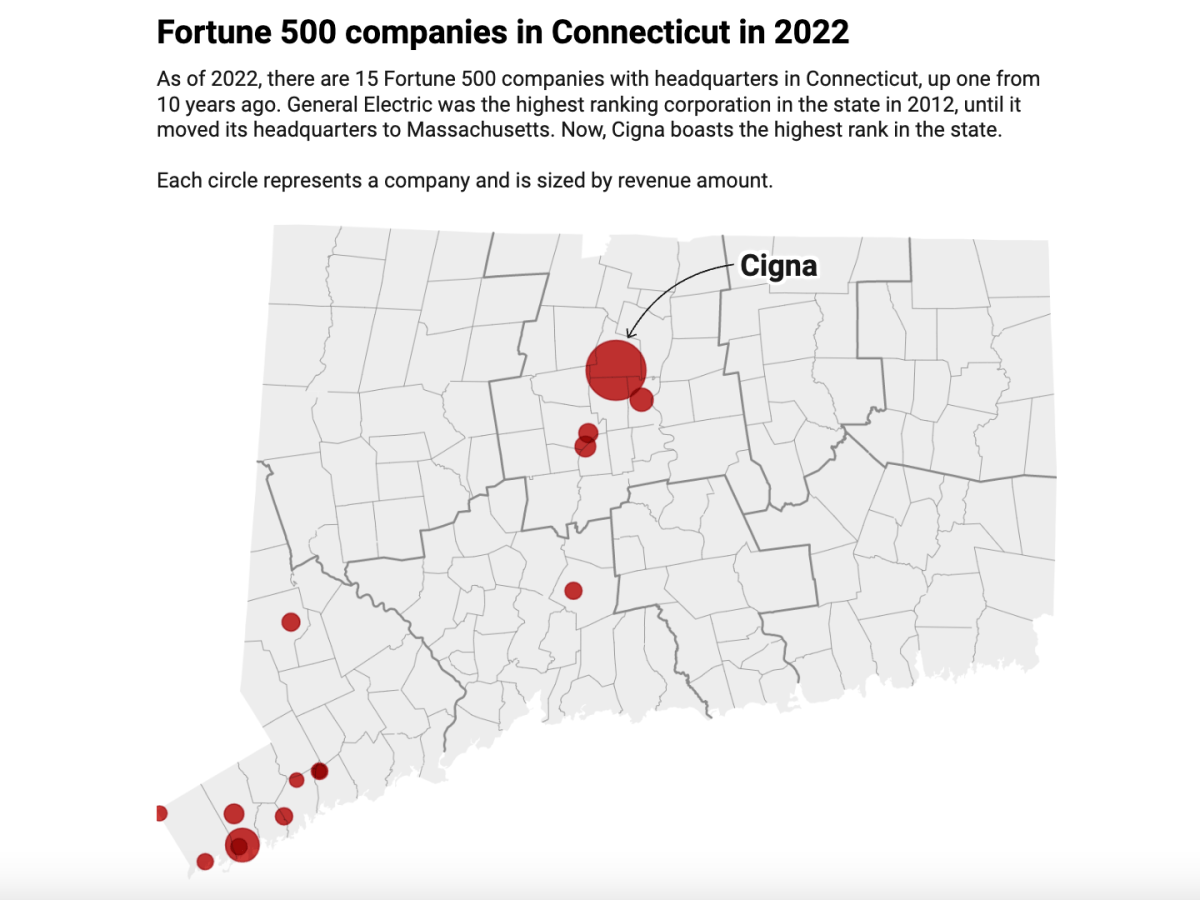
MAPS: Fortune 500 companies in Connecticut in 2012 and 2022
The number of Fortune 500 companies headquartered in CT increased from 14 to 15, with changes in the companies representing the state.
Posted inData
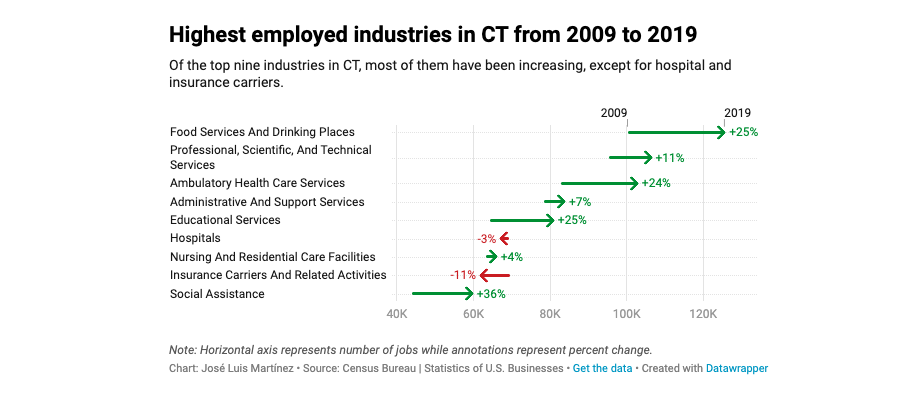
CHART: Highest employed industries in Connecticut from 2009 to 2019
The top nine job industries in CT in 2009 have remained the same up to 2019, Census data shows. And most have gained workforce members.
Posted inData
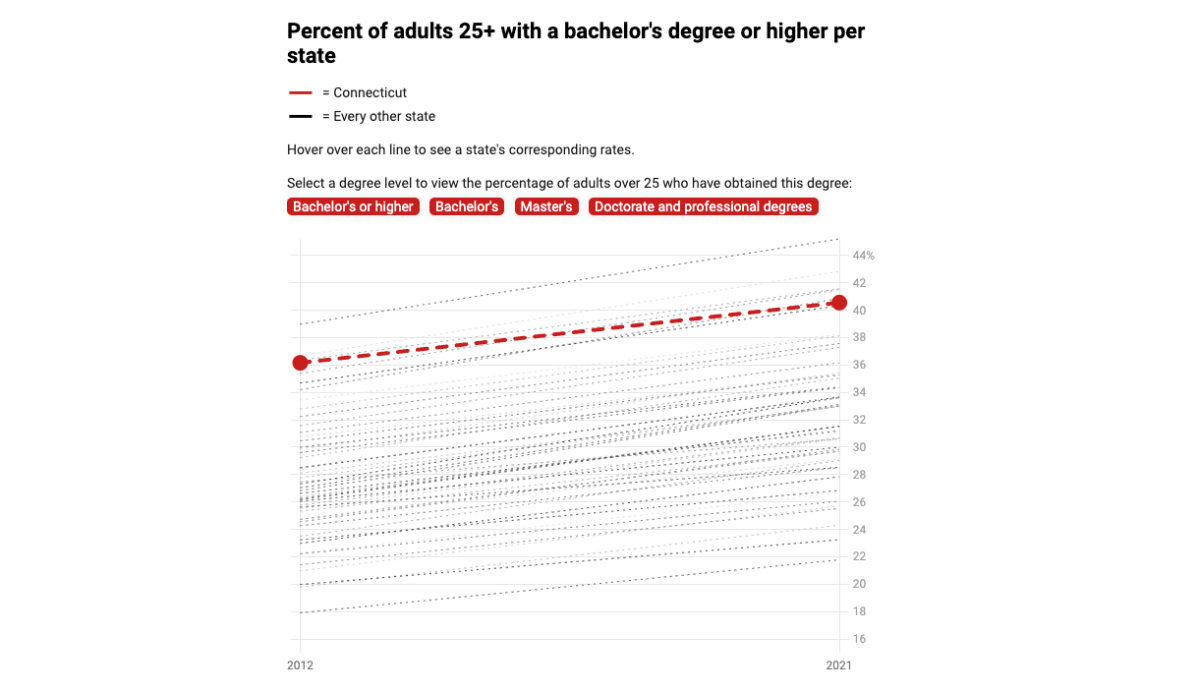
CHART: College-educated adults in CT vs. other states
In 2012, CT ranked 4th nationwide with 36.2% of adults holding a bachelor’s degree or higher. The state’s ranking has since dropped to 6th.
Posted inData
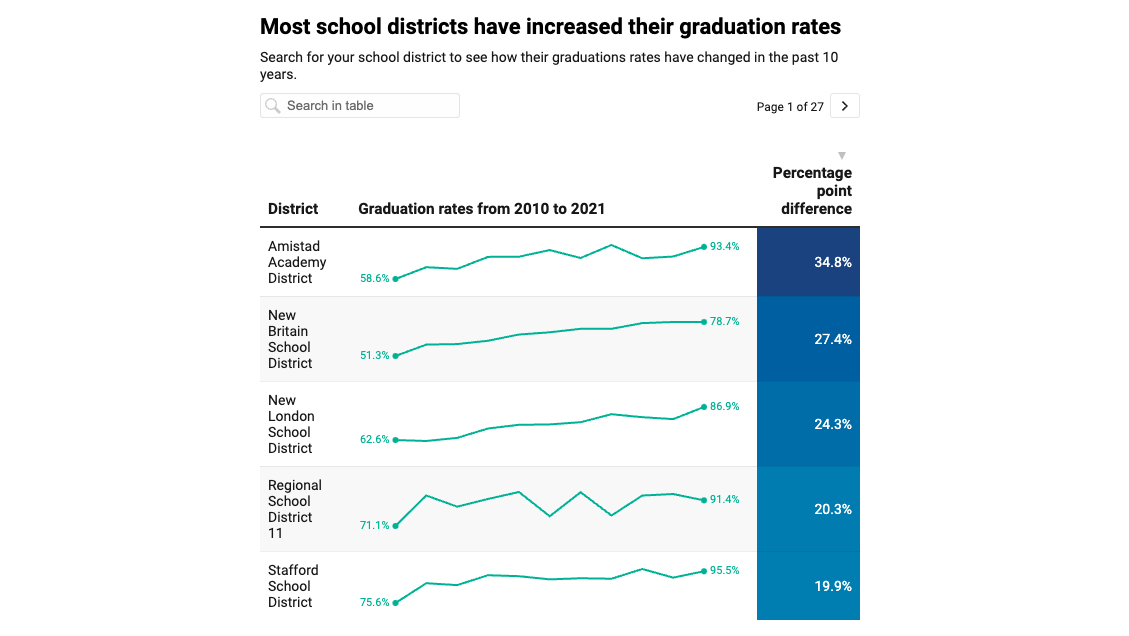
CHART: CT high school graduation rates are improving
From the 2010-11 school year to 2020-21, CT’s four-year graduation rate increased 6.9 percentage points. See how your school performed.

Posted inData
CHART: Migration in and out of CT from 2011 to 2020
Data show that New York sent the highest number of people to CT from 2011 to 2020, followed by Massachusetts and Florida.
Posted inData
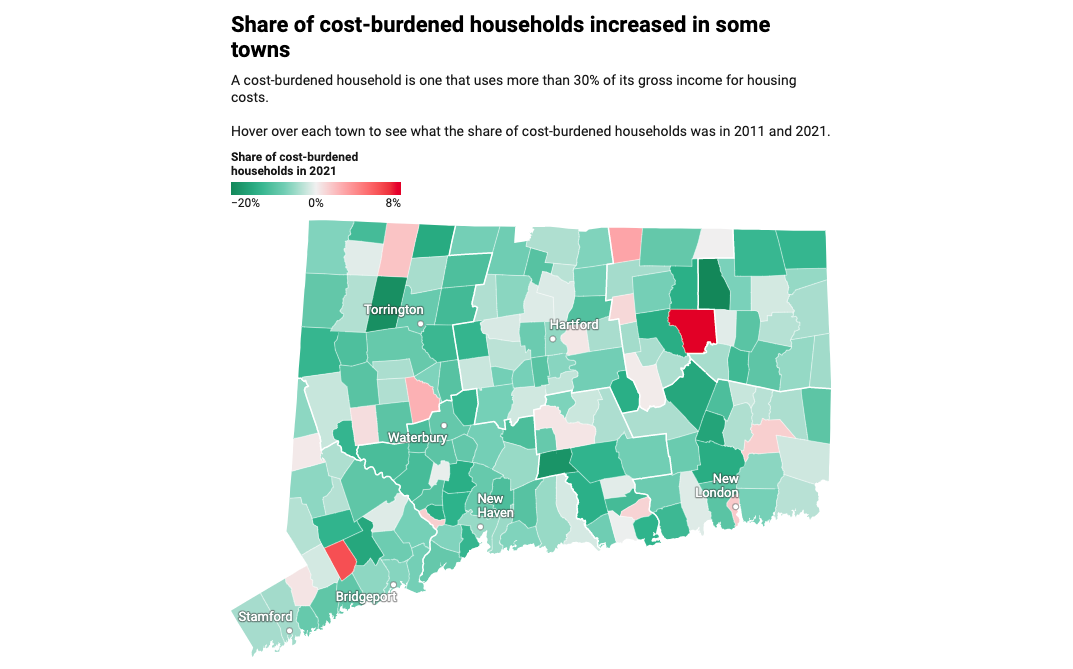
MAP: Percentage of ‘cost-burdened’ households in each Connecticut town
As of 2021, 34% of CT households are “cost-burdened,” meaning they spend more than 30% of their income on housing. Here’s the percentage in each town.

Posted inData
CHART: CT has become more racially diverse since 2011
The white population is still the largest racial group in CT. But its share of the population fell from 2011-2021 while every other racial group’s share rose.

Posted inData
CHART: Share of chronically absent CT students by student group from 2017-2022
Since the COVID-19 pandemic began, chronic absenteeism has doubled in CT schools. Here’s a breakdown of the student groups that are missing class.

Posted inData
MAP: Connecticut’s 2021 affordable housing units, by town
Explore the percentage of housing units in each CT municipality that were considered affordable in 2011, 2019, 2020 and 2021.