
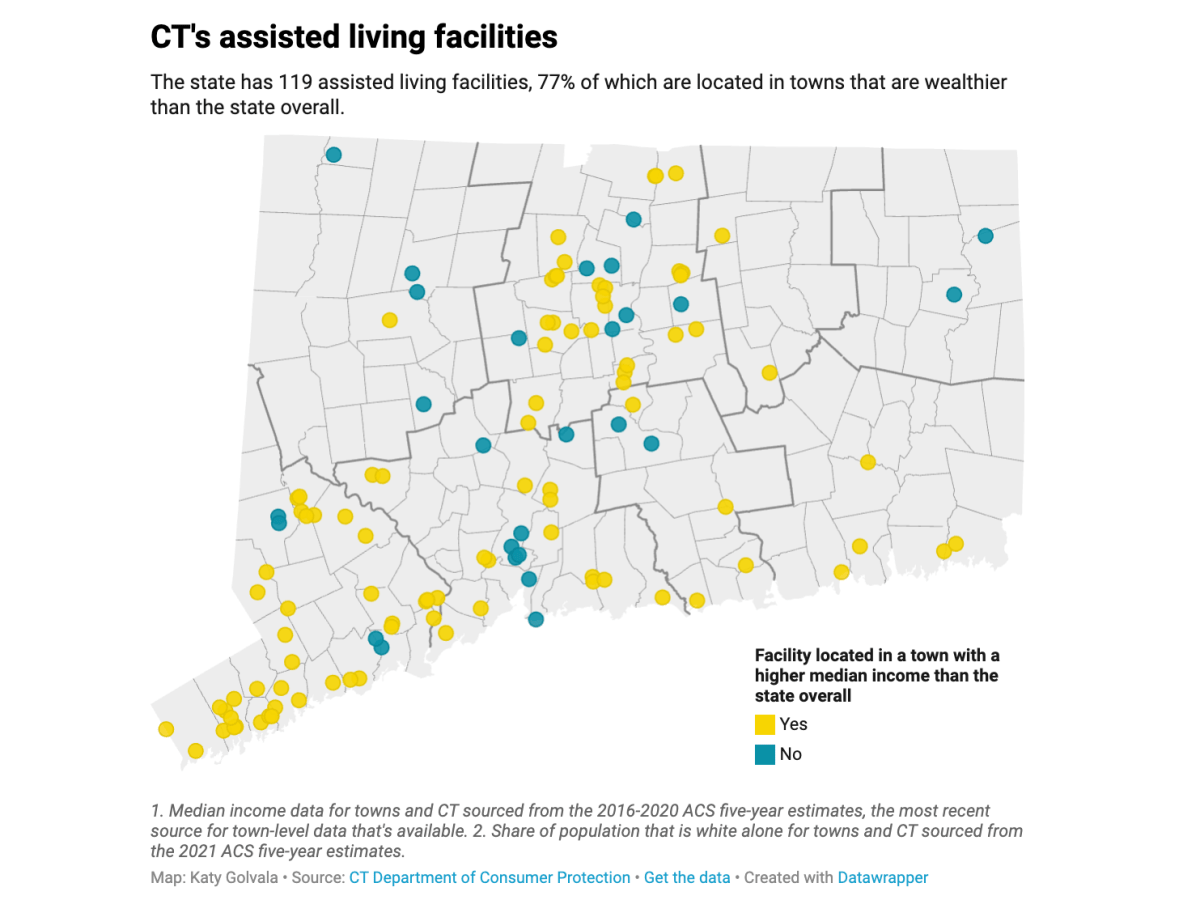
Here’s a map of every assisted living facility in CT, 68% of which are located in towns that are wealthier and whiter than the state overall.
CT Mirror Data
Posted inData
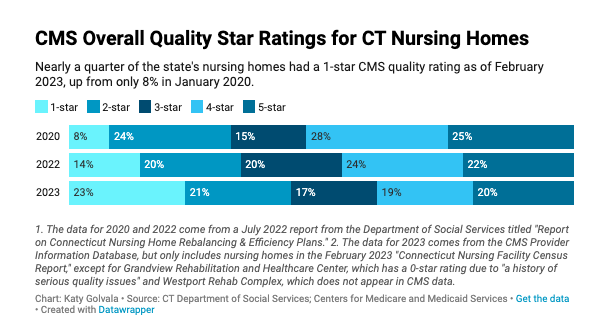
CHART: CMS overall quality star ratings for Connecticut nursing homes
Nearly a quarter of CT’s nursing homes had a 1-star CMS quality rating as of February 2023, up from only 8% in January 2020. Here’s the data.
Posted inData
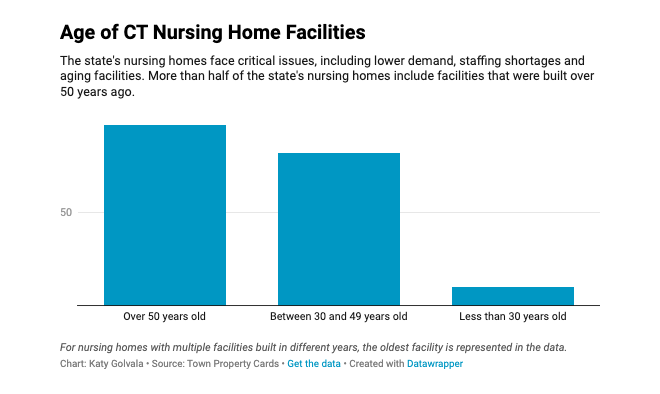
CHART: Age of Connecticut nursing home facilities
More than half of CT’s nursing homes include facilities that were built over 50 years ago. Here’s the data.
Posted inData
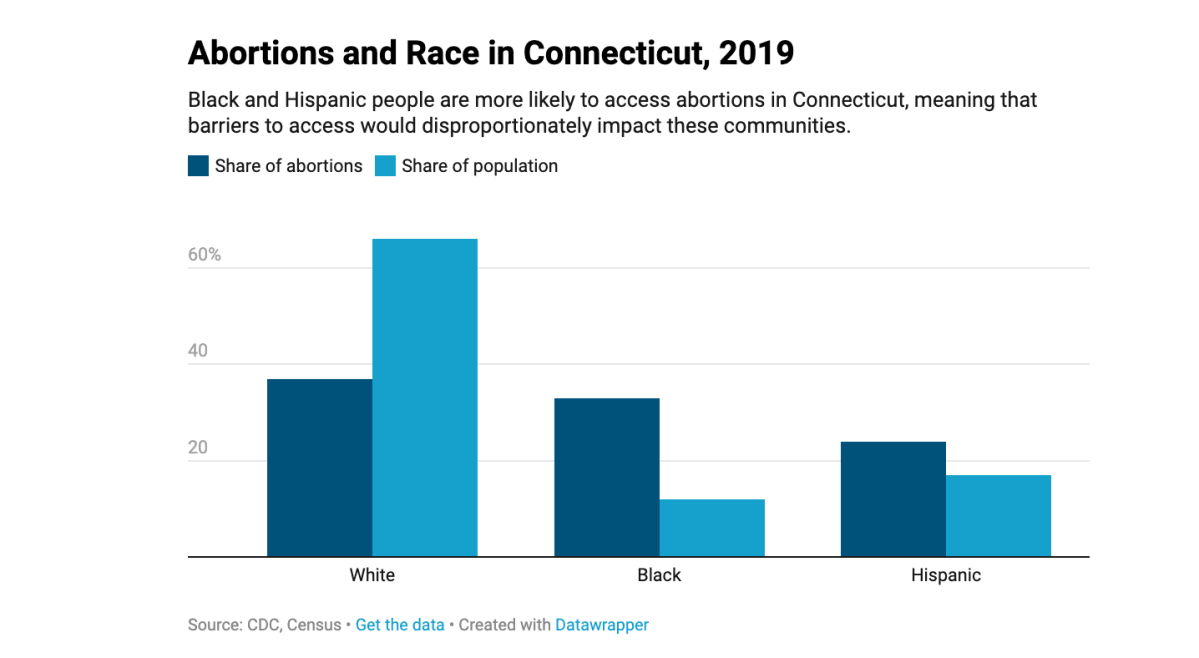
CHART: Abortions and race in Connecticut, 2019
In 2019, Black and Hispanic people accounted for 57% of abortions in Connecticut but only accounted for 19% of the overall population.
Posted inData
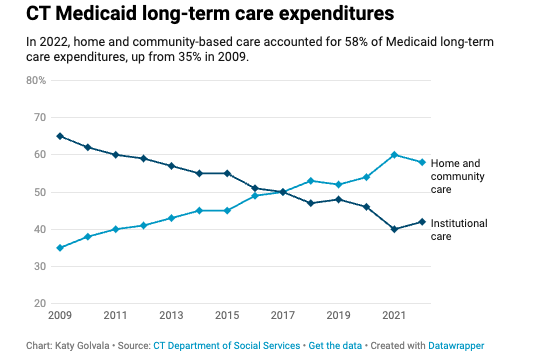
CHART: CT Medicaid long-term care expenditure comparison
Ever since 2018, CT has spent more Medicaid funds each year on home and community-based long-term elder care services than on institutional care. Here’s the data.
Posted inData
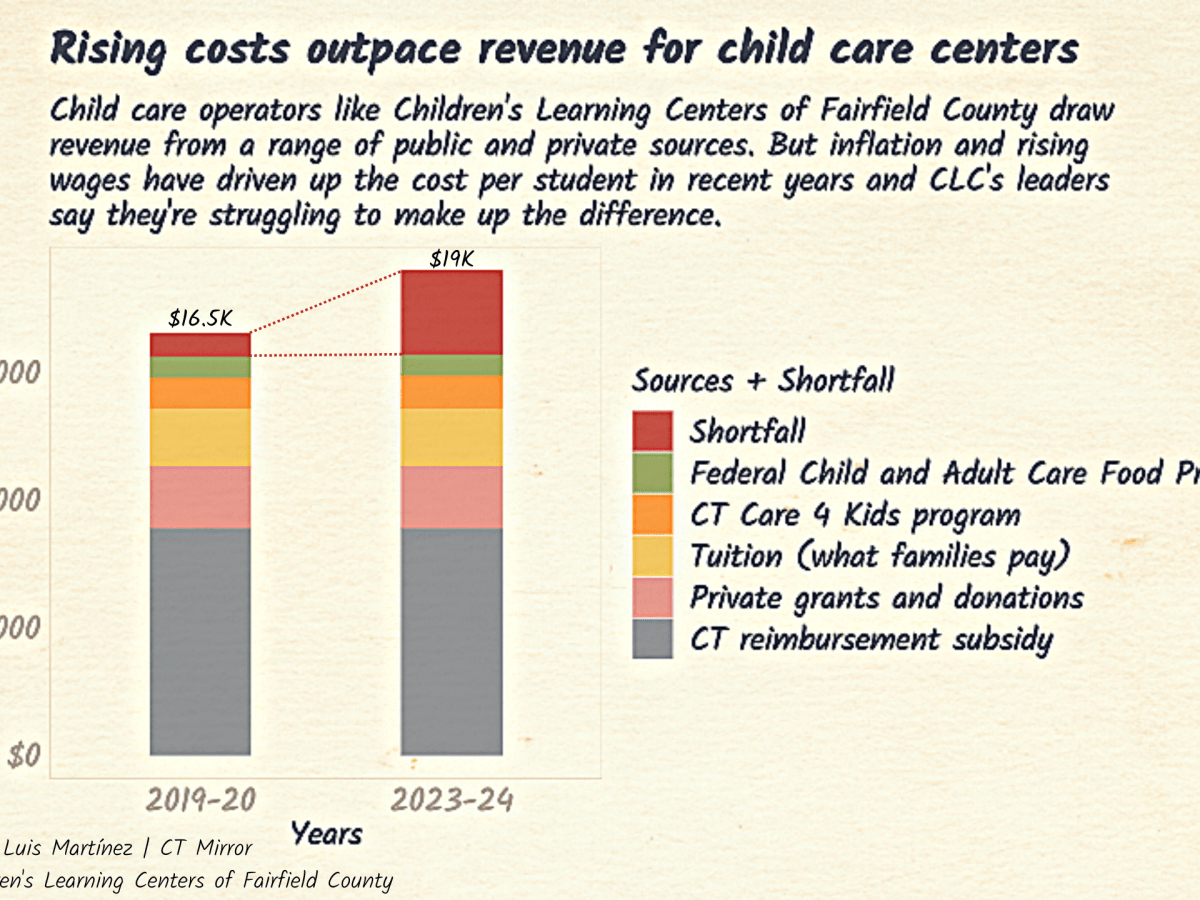
CHART: Rising costs are outpacing revenue for CT child care centers
Connecticut child care operators say costs have gone up steadily in the last four years but most of the state’s subsidies have remained flat.
Posted inData
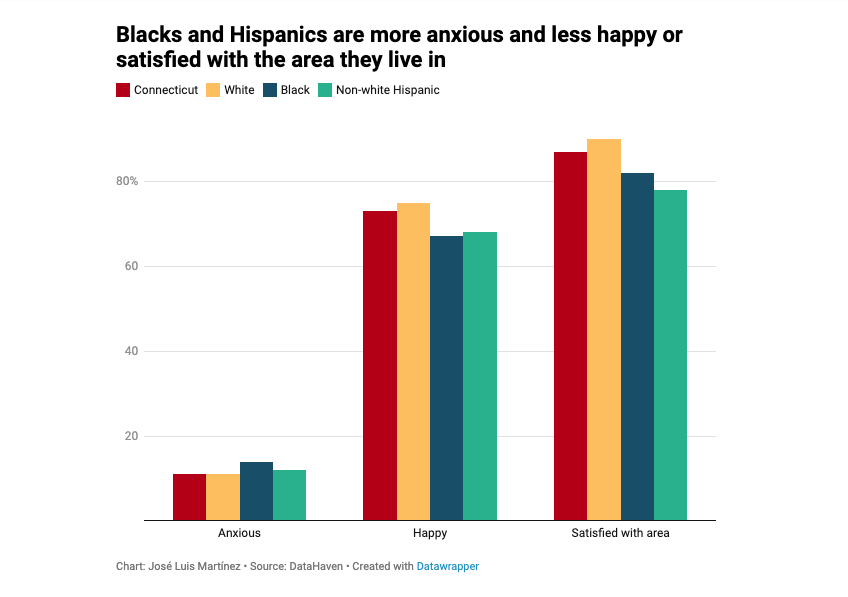
CHART: Black, Hispanic CT residents are more anxious, less satisfied with where they live
Connecticut’s non-white respondents had lower levels of happiness and satisfaction with the area in which they live.
Posted inData
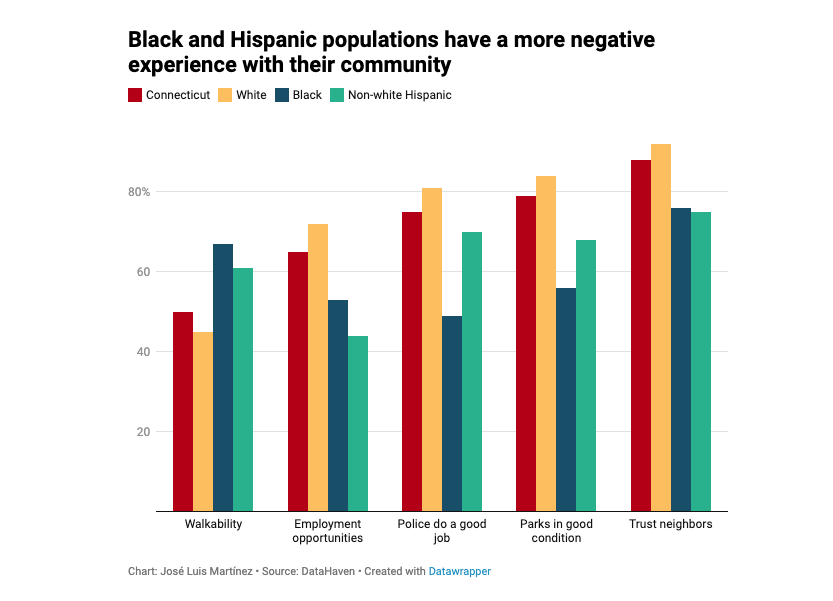
CHART: Black, Hispanic populations in CT have more negative experience with their community
Seventy-six percent of Black respondents and 75% of Latinos trust their neighbors in Connecticut, compared to 92% of whites.
Posted inData
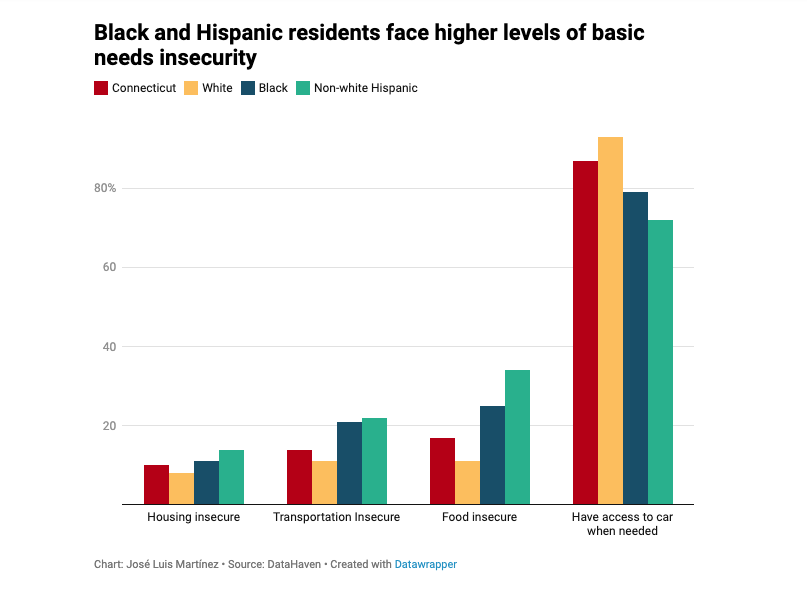
CHART: Black, Hispanic CT residents face higher levels of basic needs insecurity
Connecticut’s Latino population had the highest levels of insecurity related to housing, food and transportation.
Posted inData
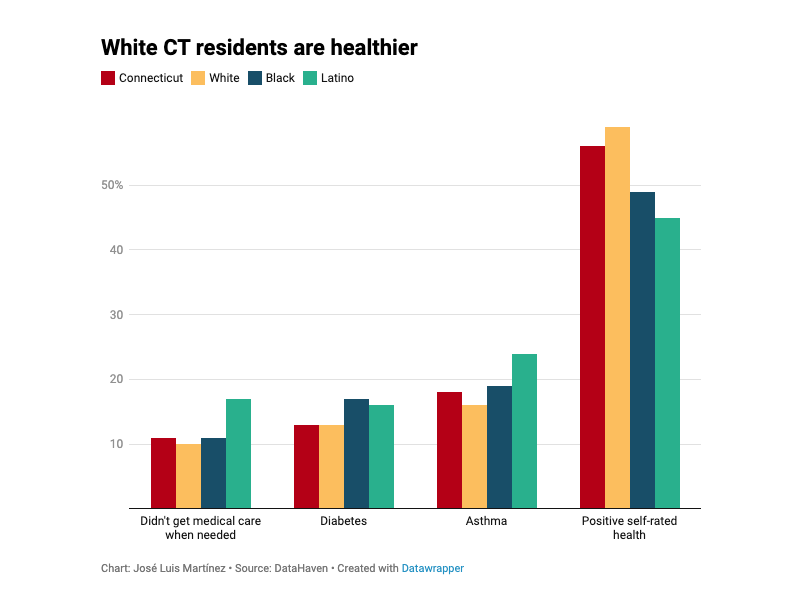
CHART: White CT residents are healthier than non-white residents
Connecticut’s white respondents self-reported higher levels of overall health compared to the lowest rate, reported by Latinos.
Posted inData
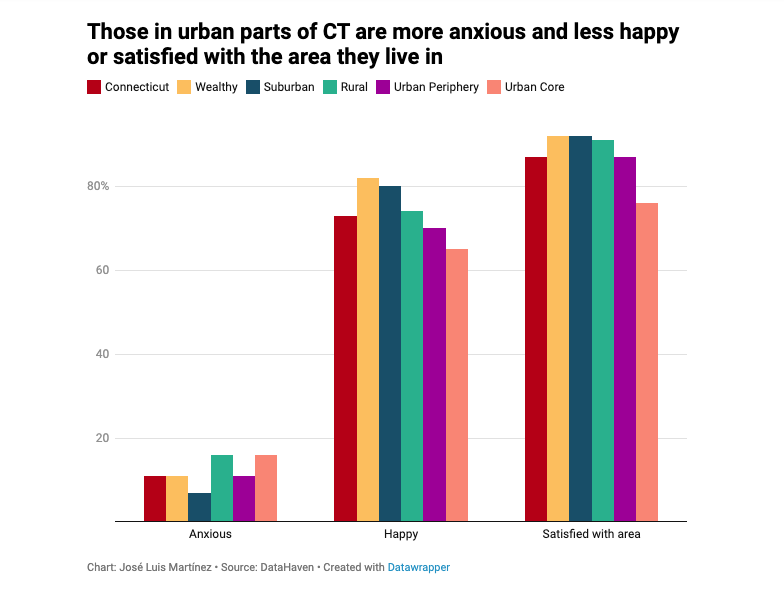
CHART: CT urban residents are more anxious, less satisfied with where they live
Connecticut residents in urban core areas had the lowest levels of happiness and satisfaction, wealthy and suburban towns had the highest.
Posted inData
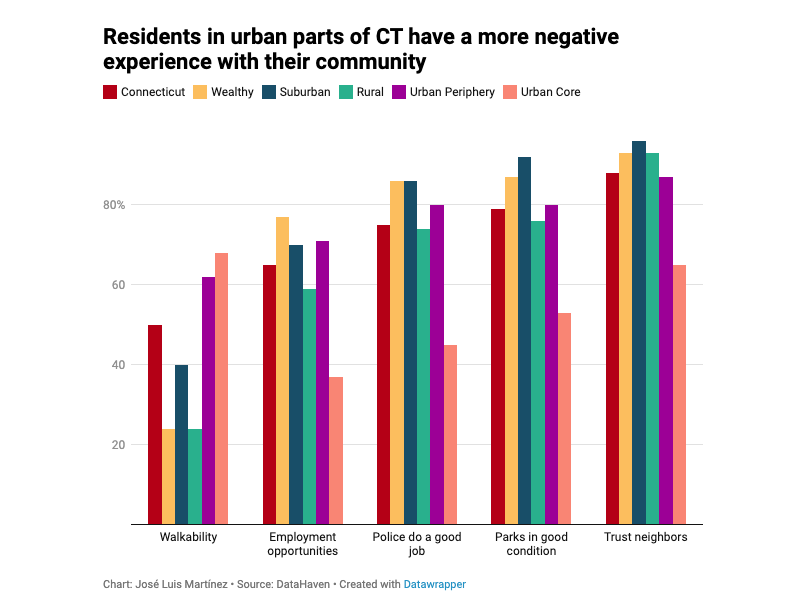
CHART: CT urban residents have more negative experience in their community
Connecticut residents in urban core areas had the lowest levels of trust with neighbors and belief they have good employment opportunities.
Posted inData
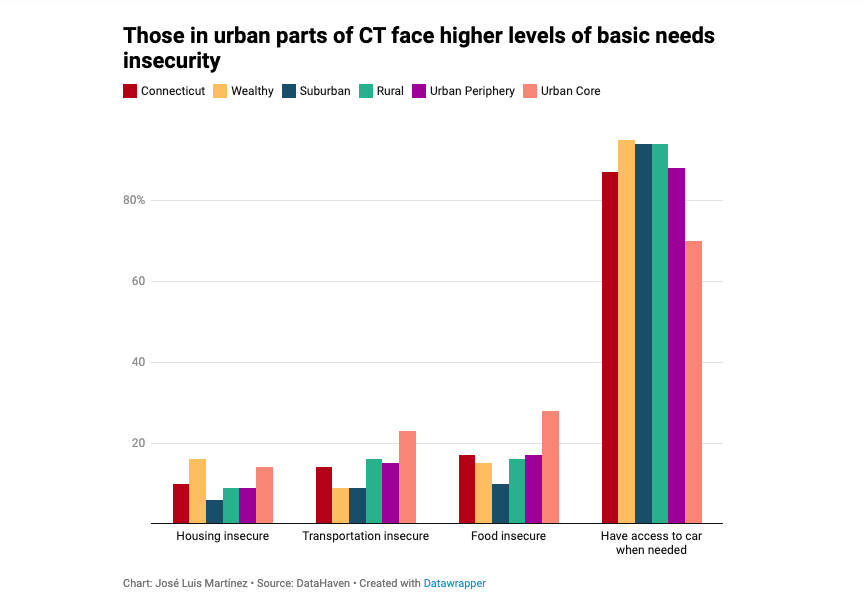
CHART: CT urban residents face higher levels of basic needs insecurity
Connecticut’s urban core areas faced the highest levels of insecurity for transportation and food. Suburban areas had the lowest insecurity.
Posted inData
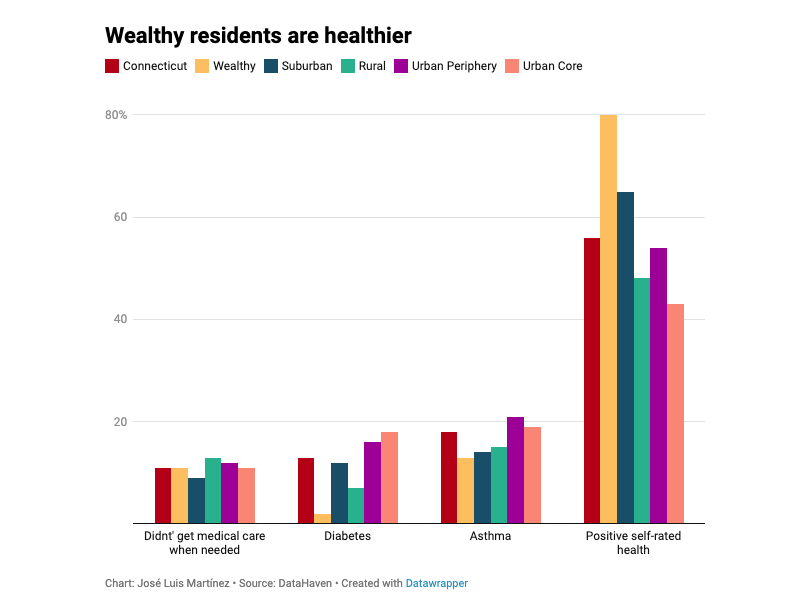
CHART: Wealthier CT residents are healthier than non-wealthy residents
Connecticut’s urban core and periphery towns had the highest rates of diabetes and asthma and one of the lowest levels of overall health.
Posted inData
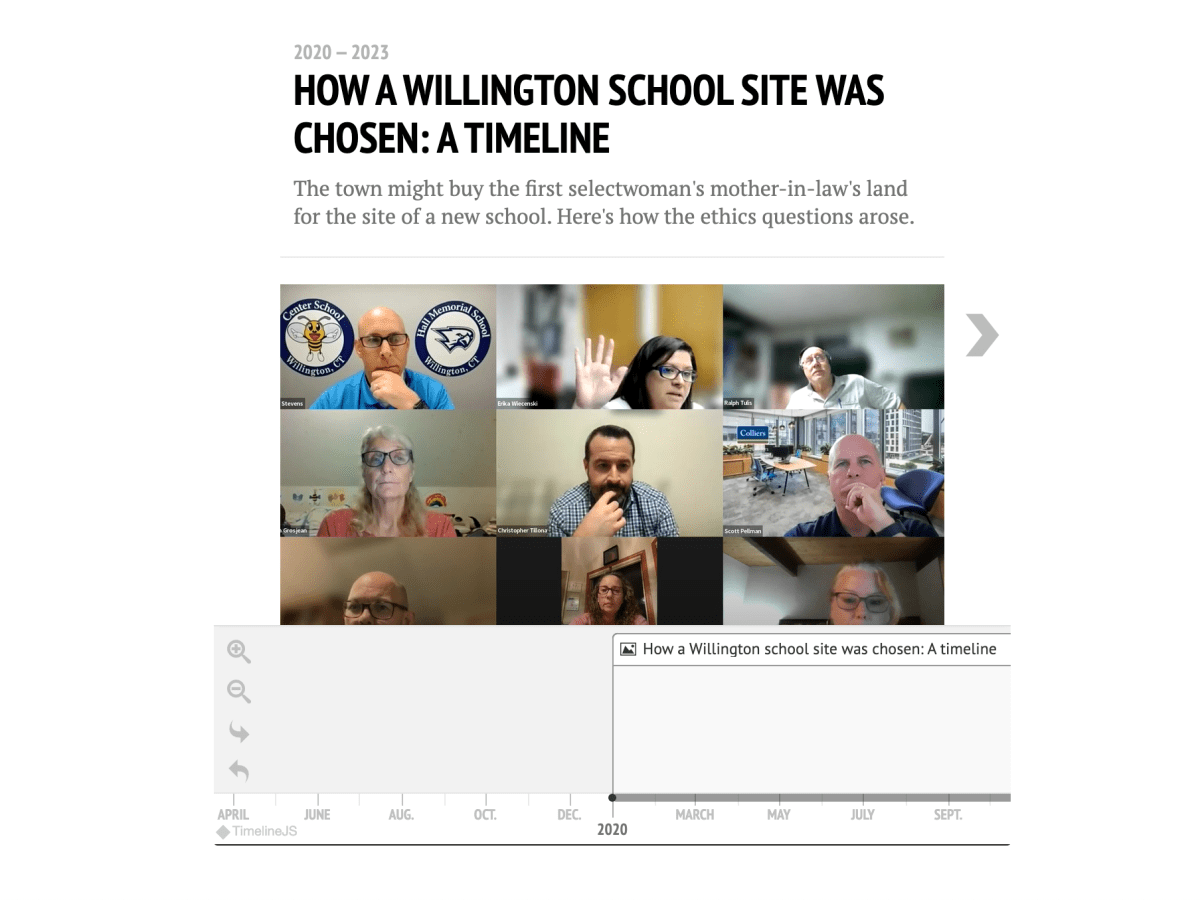
TIMELINE: How a controversial Willington school site was chosen
The town might buy the first selectwoman’s mother-in-law’s land for the site of a new school. Here’s how the ethics questions arose.