

July 2020 and January 2021 broke records, and then the numbers stabilized to a monthly amount higher than the pre-pandemic average.

CT Mirror Data
Posted inData
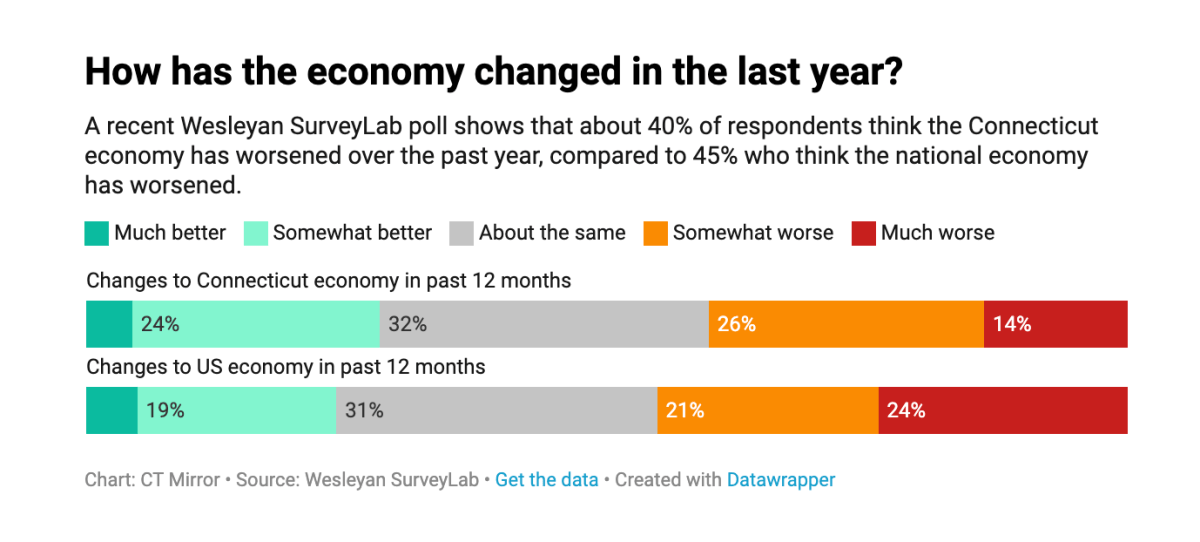
CHART: How do CT voters feel about the economy?
Forty percent of those surveyed think CT’s economy has worsened in the past year, while 32% said it’s about the same and 28% see improvement.

Posted inData
CHART: Rapid rise in Latino and ESL students at Danbury High School
Danbury has just one public high school, which educates nearly 3,600 students and is the biggest high school in CT.
Posted inData
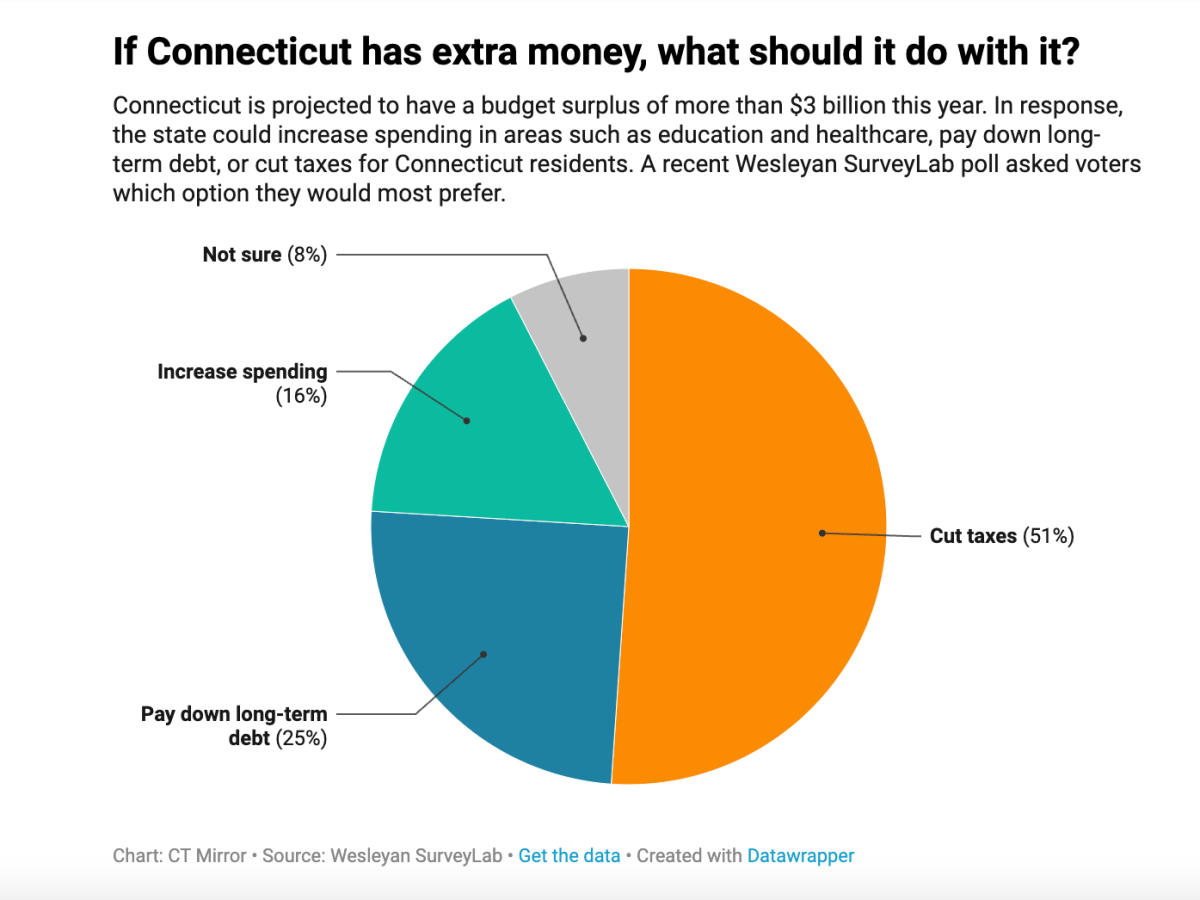
CHART: If Connecticut has extra money, how do voters think it should be used?
A Wesleyan SurveyLab CT Poll released Monday offers ammunition to both sides of the fiscal debate in Connecticut.

Posted inData
CHART: What do CT voters think is the state’s most important problem?
According to a Wesleyan poll, pocketbook concerns ranked highest when voters were asked to select the most important problem facing CT.

Posted inData
CHART: How do CT voters feel about Lamont, Biden?
According to a Wesleyan poll, 60 percent of CT voters say they approve of Gov. Ned Lamont’s performance. Joe Biden didn’t fare as well.
Posted inData
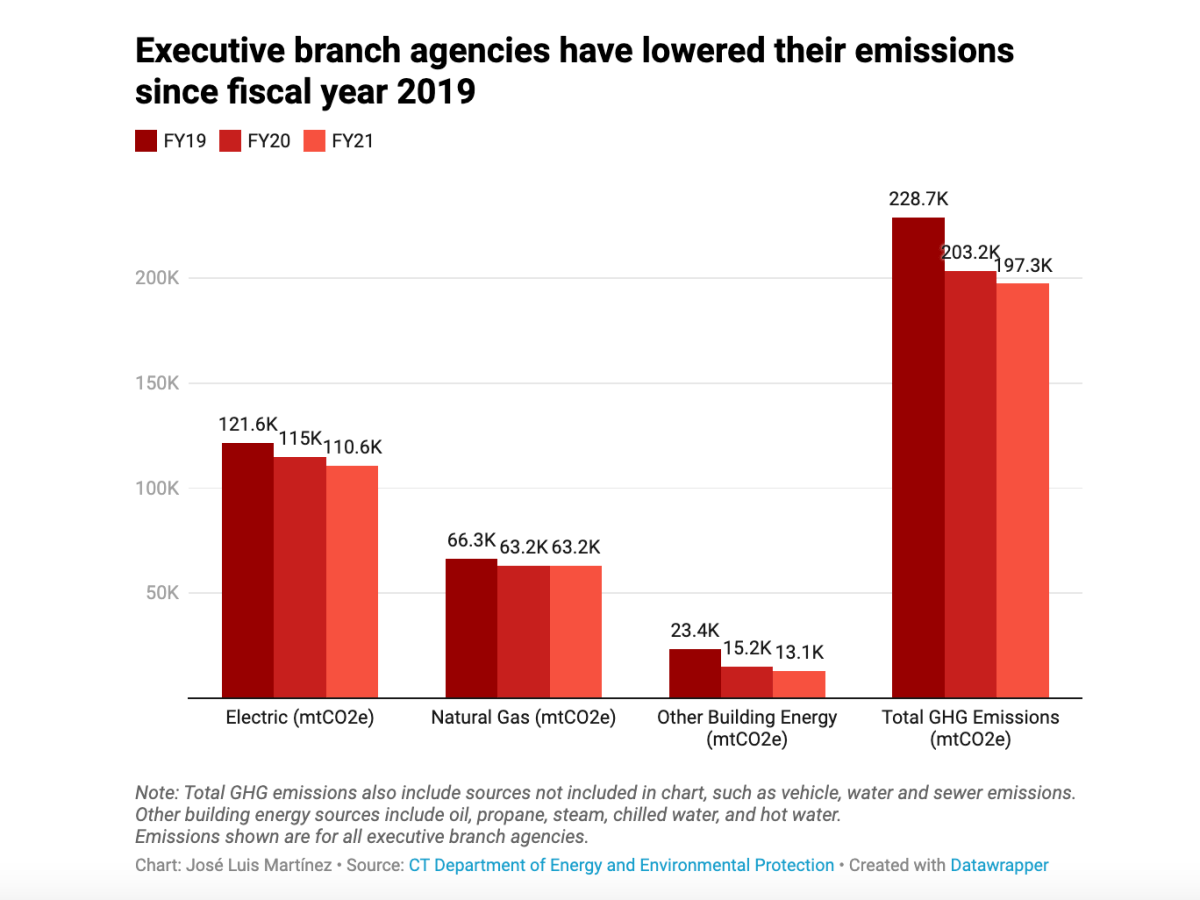
CHART: CT executive branch agencies have lowered their emissions since fiscal year 2019
For about a dozen years the state of Connecticut has been trying to cut emissions in the buildings it owns. Has it made any progress?
Posted inData
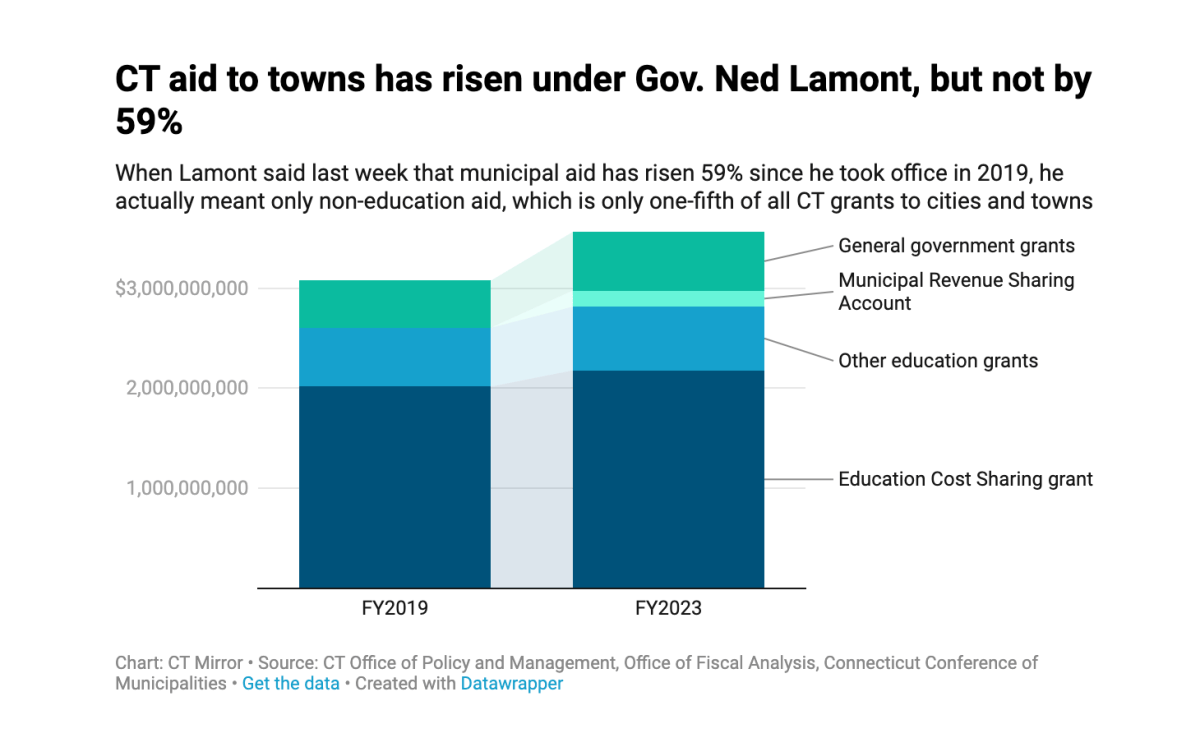
CHART: Has money to CT towns risen under Gov. Ned Lamont?
Gov. Ned Lamont recently claimed that “Municipal aid’s up about 59% since we took office.” Did aid to CT towns grow as he claimed?
Posted inData
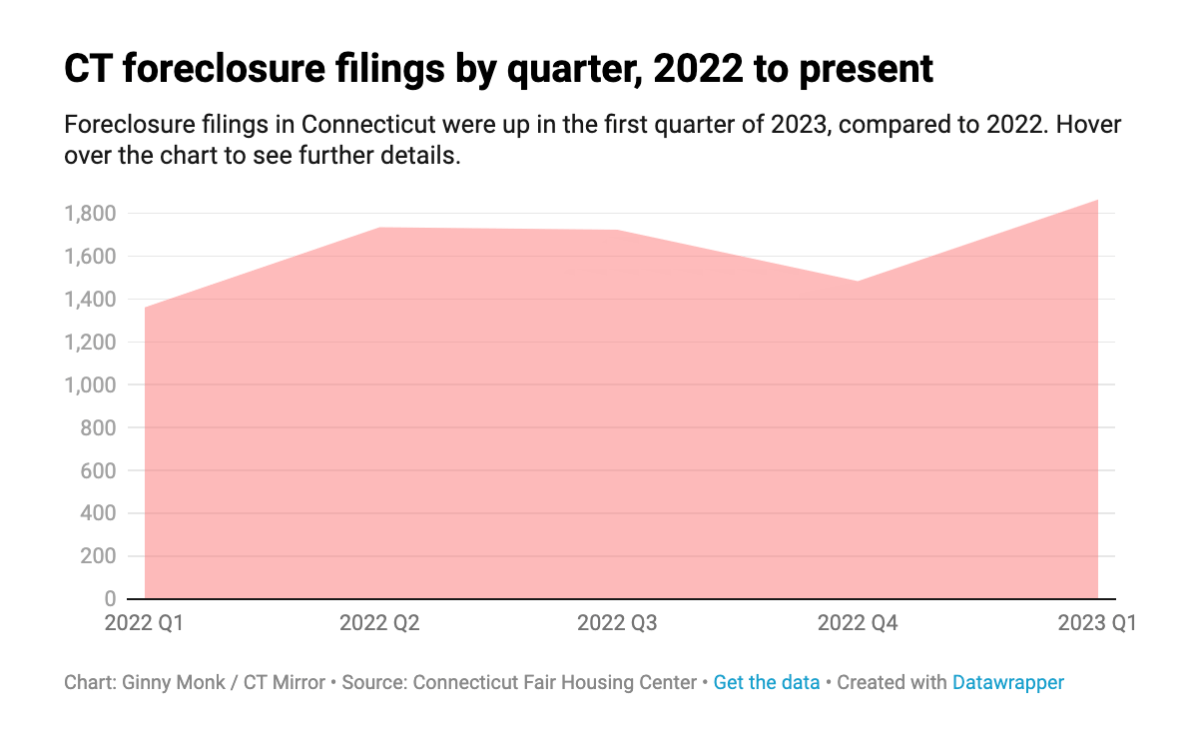
CHART: CT foreclosure filings by quarter, 2022 to present
CT foreclosure filings — an early stage in the foreclosure process — were up in the first quarter of 2023, compared to 2022. Here’s the data.
Posted inData
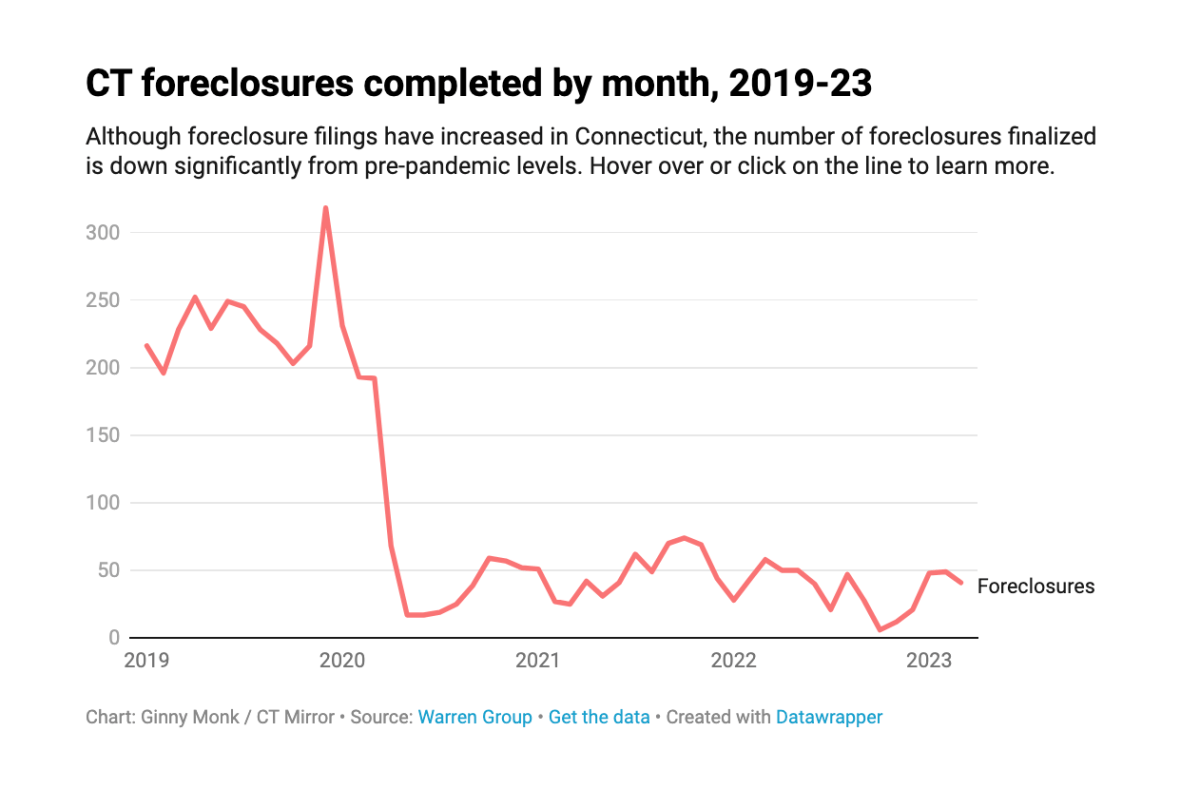
CHART: CT foreclosures completed by month, 2019-23
Although foreclosure filings have increased in CT, the number of foreclosures finalized is down significantly from pre-pandemic levels. Here’s the data.

Posted inData
CHART: Number of affordable housing units CT may lose each year
Affordability requirements will expire on thousands of CT units over the next few years, and others will likely fall into disrepair.

Posted inData
CHART: Number of opioid-related deaths in Connecticut, 2013-2022
Over 7,000 people in CT died due to opioid overdoses in the past five years alone. Here’s the state’s overdose death data from 2013-2022.

Posted inData
MAP: CT towns that lack direct access to naloxone
Despite FDA approval of Narcan, which is used to reverse opioid overdoses, some people in CT may have trouble obtaining it over-the-counter.

Posted inData
MAP: Which parts of Connecticut are served by public water providers?
The Metropolitan District Commission, Regional Water Authority, Aquarion Water, and Connecticut Water Company deliver water to CT residents.

Posted inData
CHART: Growth of home companion agencies in CT
Over the last 10 years, the number of home companion agencies in CT — whose workers aren’t required to be licensed — grew from 308 to 903.