


The state’s public education system has reached a pivotal time.
The Connecticut Supreme Court is set to hear arguments today in a landmark school-funding case. And with the state facing major projected deficits for the foreseeable future, it might take an order from the high court for much more money to reach Connecticut’s most impoverished districts.
The court will be hearing an appeal from a ruling in which Superior Court Judge Thomas Moukawsher found the state’s method of distributing aid to schools to be “irrational,” and thus unconstitutional. His ruling included a scathing indictment of the education students receive in the state’s most impoverished districts.
A separate, 21-year-old case in which the Supreme Court ordered the state to desegregate Hartford schools also may be headed back to court because of a stalemate over how to further implement that order. Here, in graphical form, are some key indicators of the condition of the state’s public education system.
Fewer students enrolled in school
Over the last 10 school years, enrollment in public schools throughout the state has dropped by nearly 36,000 students – a 6 percent decline. And over the next nine years, the state is projected to lose another 70,300 students – a 13 percent decline.
Each district is experiencing different enrollment trends. Of the state’s 172 traditional public school districts, 141 have seen enrollment drop by at least 5 percent over the last 10 years. The total does not include charter, regional magnet or other schools students enroll in through a lottery.
Small school districts have seen their enrollment drop the most. Of the 31 districts whose enrollment dropped by more than 25 percent, none had more than 1,036 students last school year.
Most of the state’s large school districts saw increases in enrollment, however. Of the eight districts that had more than 10,000 students last school year, six have seen enrollment increases. In the state’s 30 lowest-performing districts – known as Alliance Districts – only seven, mostly the large districts, have increased enrollment.
School choice options for Connecticut students – magnets, charters and other schools of choice – have increased steadily. Ten years ago, nearly 34,000 students were attending non-traditional public schools they had to apply to – one in 17 public school students. Last school year, just over 66,500 students attended schools of choice, or one in eight students.
Poverty is concentrated – and getting worse
The number of children from low-income families in Connecticut public schools has been steadily increasing. Ten years ago, 165,048 students came from families that qualified for free or reduced-price school meals. Last school year, there were 193,240 such students. The additional 28,200 students from low-income families overwhelmingly showed up in schools that already had high concentrations of poverty.
To qualify for free or reduced-price lunches, a child’s family must earn less than 185 percent of what the federal government has determined is the poverty threshold. For a single mother, that was less than $30,000 for reduced-price meals or about $21,000 for free meals last school year. Median household income in Connecticut was $71,346.
Last school year, 115,000 students – one of every five public school students in the state – attended a school where more than 60 percent of the students came from low-income families. At the other end of the spectrum, 104,000 students attended schools where fewer than 10 percent of the students were poor.
The good news, however, is that the number of students attending hyper-segregated schools has declined. These are schools where more than 80 percent or fewer that 20 percent of students are in poverty. Many minority students remain in segregated schools, however.
Much has changed since 1969, when Connecticut changed its laws to comply with the U.S. Supreme Court’s landmark Brown vs. Board of Education desegregation decision in 1954. Then, only a handful of suburban Connecticut towns had a student population with more than 5 percent minorities. By 2012, data shows, dozens of school districts had integrated schools as more minorities moved into the state.
Minority isolation in some large cities, however, has intensified.
In Bridgeport, for example, the percentage of minority students in public schools has risen progressively from 51 percent in 1968, to 84 percent in 1988, to 86 percent last school year. Connecticut is in 13th place in the U.S. for most segregation of its black students and in 14th place for segregation of Hispanic students in public schools, according to UCLA’s Civil Rights Project. The center reports that the segregation often coincides with the segregation of students from poor families.
Many CT students soar – but some sink
The children of the wealthy outperform the students from middle-class and poor families. This may not seem like news, but researchers at Stanford’s Center for Education Policy Analysis have gathered troves of student test scores and family income data and have found that the differences have grown substantially in recent decades. Gaps in achievement between the state’s most vulnerable students and their peers have remained unchanged since students began taking the Smarter Balanced Assessments three years ago. The majority of students from low-income families test far below where they should on reading and math, and less than one-third are proficient in those subjects. In the state’s lowest-achieving districts, the situation is even more dire. In Bridgeport and Hartford, two of the largest school districts in the state, only a quarter of the students are reading at grade level and half are significantly behind. Connecticut for years has had among the nation’s largest gaps in achievement between poor students and their better-off peers. Compared to poor students in other states, Connecticut’s students from low-income families are almost last on the so-called “Nation’s Report Card” in math. In reading, they are middle of the pack in fourth grade and by 8th grade are in 17th place.
CT’s school buildings: ‘A state of disrepair’ or a ‘building boom’?
In an era of declining enrollment in most communities, a survey the State Department of Education does of Connecticut’s public schools found that 71 percent of high schools were under 90 percent full, and less than 85 percent of middle and elementary schools were full. That survey found that one out of every 40 elementary schools needed asbestos remediation and the local district had no immediate plans to do the work. One out of every 25 elementary or high schools and one out of every 29 middle schools had a roof problem, and repairs had not been scheduled to fix the underlying issue. One in 13 schools had poor air conditioning, and one in 70 had a poor heating system.
In the state’s most impoverished districts – Bridgeport, Hartford, New Haven, New London, New Britain, Waterbury, Windham – a lower percentage of the schools had areas of their buildings rated as being in fair or excellent condition.
In the most affluent districts – Darien, Easton, New Canaan, Redding, Ridgefield, Weston, Westport and Wilton – 88 percent of the schools either had been built in the last 20 years or had had a major renovation, compared to 71 percent in the high-poverty districts.
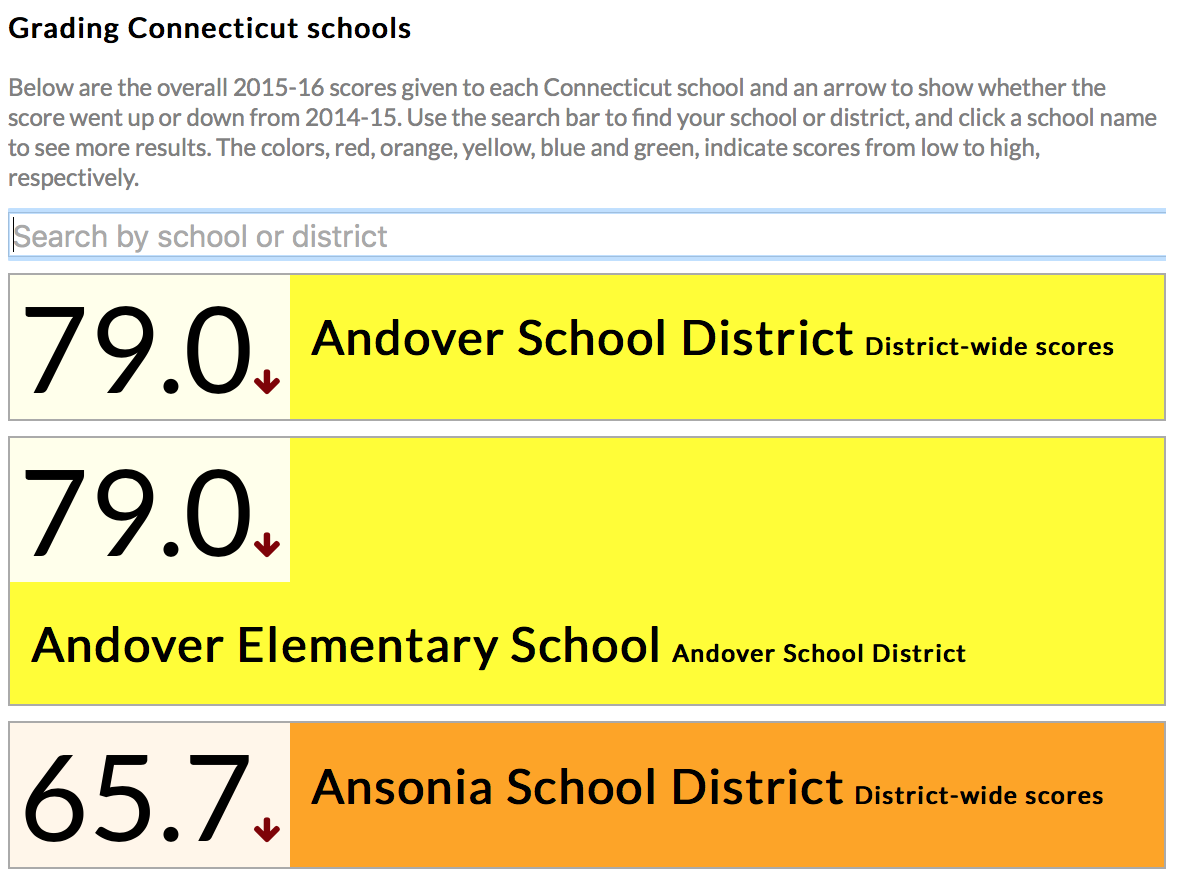
CT gives a grade to every school
Each year the State Department of Education gives every public school and school district a zero-to-100 grade. The state’s grading system is based on more than a dozen different measures, including test scores and factors such as how many students are chronically absent, enroll in arts and Advanced Placement college-prep courses, graduate from high school, and enroll in college within a year of graduation.
About half of an elementary or middle school’s score is based student growth on standardized tests — a measure aimed at giving the public an indication whether their schools are improving. To calculate this, an individual student’s test score is subtracted from their scores the previous year.
Almost two out of every three students improved their scores on the state’s math and/or English tests between the 2014-15 and 2015-16 school years. About 7 percent fewer high-need students showed increased scores. Fifty-eight percent of the state’s English language learners, disabled children and students from low-income families showed growth in their test scores.
Another 40 percent of each school’s grade comes from the performance of the school’s students on the standardized tests in a single year. (Read more here)
Graduation rates rise, but have students learned what they need?
Graduation rates in both high-achieving and struggling school districts have been rising for years. What to make of graduation rates has been a focus of much scrutiny in recent months, after a handful of educators testified during a school funding trial last year that it is possible to graduate high school – and be illiterate.
Among the 72 percent of Connecticut students in the Class of 2010 who went on to college, at least 22 percent had to take non-credit courses to learn reading, writing or math skills they should have acquired in high school. Among the 58 percent of Bridgeport’s Class of 2010 who went to college, at least half had to take a remedial course.
It’s unclear whether things have improved along with the graduation rates since then because the state has not made public updated data. These rising graduation rates coupled with low standardized test scores and high demand for remedial courses when students reach college were among the reasons that Judge Moukawsher ruled that the state fails to provide students with the education the state constitution says they are entitled to.
“What it means to have a secondary education is like a sugar-cube boat. It dissolves before it’s half launched,” Moukawsher wrote. “State graduation and advancement standards are so loose that in struggling cities the neediest are leaving schools with diplomas but without the education we promise them.”
Staffing challenges
Thousands of students each year are being taught by long-term substitutes – most of them in the state’s lowest-performing districts – because there is a shortage of qualified teachers for several subject areas. On Oct. 1, 2014, one month into that school year, 250 teaching positions were unfilled statewide. And the situation hasn’t improved since then, which has led the state’s education commissioner to propose an overhaul of how teachers become certified. Attracting talent to school districts overwhelmed with students who have experienced trauma or the affects of poverty is difficult, educators testified at length during the school-funding trial. Despite demonstrably greater needs – many of the state’s most impoverished districts have significantly fewer guidance counselors social workers, psychologists and special education teachers, per student. In many of the state’s chronically failing districts, class sizes are also larger and the average teacher’s salary is lower, data from the State Department of Education show.
Limited control over state spending on education
The state now spends about $700 million each year to pay off the debt incurred for school construction projects. Couple that with well over $1 billion the state must contribute each year for teachers’ pensions, and about 40 percent of the state’s annual education spending has locked in for years to come. The fastest growing costs districts face are for staffing and special education services. Educators have long said that much of those costs are outside their control because of state and federal laws aimed at ensuring disabled students get the services they require. But, as a result, those costs are crowding out resources for other supports in schools. However, state education officials disagree that special education costs are outside a district’s control. Rather the problem, state education officials testified during the trial, is that local educators sometimes resist embracing proven strategies that work.
“My opinion is the vast majority of kids are not disabled; they’re instructionally disabled,” said Deputy Education Commissioner Ellen Cohn. “The thinking is, ‘There must be something wrong with you,’ not ‘let’s change the system.'”
She pointed to the “reading wars” over how to teach reading. On one side are those who believe the so-called whole language method is best – an approach that subscribes to the philosophy that children will naturally learn to read if immersed in books, just as they learn to speak English. Advocates believe that by treating reading as a system of words in relationship to one another, unfamiliar words will be picked up from context. On the other side are those who believe the phonics method is superior – an approach that teaches students to learn letter sounds and sound out words.
This stalemate over reading methods persists even though reading deficiencies are the top reason children without autism or biological disabilities are being referred to special education. The legislature does have control over it’s largest source of state support for local public schools – the $2 billion Education Cost Sharing grant.
One issue is that legislators routinely manipulate how components of the formula are weighted to produce a desired outcome, either for political reasons or because of fiscal constraints.
The judge in the school-funding trial took issue with this approach when ruling that the way the state funds education is unconstitutional.
The legislature and governor are currently in a standstill on how to move forward with a formula. Democratic legislative leaders and the governor agree that given the state’s fiscal problems, state aid should be cut for many middle-income and affluent communities and slightly increased for some of the struggling communities.
Republicans, however, would increase education spending so better-off towns would be shielded from cuts and funding for many of the most impoverished communities and some better-off towns would be increased.
Think you have a solution? Here’s a tool that lets you manipulate the weighting of different components in the aid formula.
(Note: The enrollment projections graphic was update the day after this article was published after the U.S. Department of Education Released updated projections.)